
FIGURE 3.
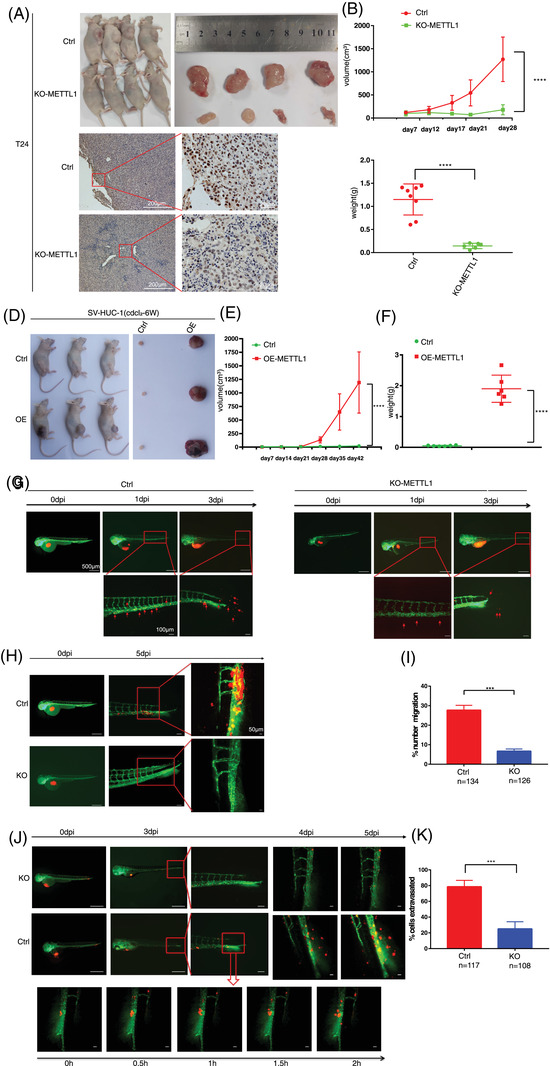
METTL1 promotes tumourigenesis in vivo. (A) Subcutaneous tumour model showed that tumours generation in mice injecting with METTL1 knockout cells had significantly smaller volume and weight than those injected with control cells. The nether panel showed representative immunohistochemistry (IHC) staining images of METTL1 in subcutaneous xenograft tumours (n = 8 in each group) Scale bars: (left panel) 200 μm, (right panel) 20 μm. (B) Growth curves of subcutaneous xenograft tumours (****P < 0.0001). (C) Weight of subcutaneous xenograft tumours (****P < 0.0001). (D) Subcutaneous tumour model showed that tumours generation in mice injecting with METTL1 overexpression cells had significantly greater volume and weight than those injected with control cells (n = 6 in each group). (E) Growth curves of subcutaneous xenograft tumours (****P < 0.0001). (F) Weight of subcutaneous xenograft tumours (****P < 0.0001). (G) Zebrafish yolk sac injected with CM‐RED cells showed distant metastases. Red shows bladder cancer (BC) cells, green shows zebrafish blood vessels. Red arrowhead indicates cells that migrate to tail. (H) Tumour proliferation in the tail and neovascularization were found in the T24 control group. (I) Data were expressed as the percent of cells that migrate to tail (number of cells that migrate to tail /total number of cells that injected in yolk sac *100). (n = 134 in T24 control group, n = 126 in KO‐METTL1 group, ***P < 0.001). (J) Zebrafish vascular injected with CM‐RED cells showed perforating blood vessel. Red shows BC cells, green shows zebrafish blood vessels. Red arrowhead indicates cells that perforating blood vessel. (K) Data were expressed as the percent of cells that perforating blood vessel (number of cells that perforating blood vessel /total number of cells that injected in vascular *100). (n = 117 in T24 control group, n = 108 in KO‐METTL1 group, ***P < 0.001). Scale bars: (G, H, J, left panel) 500 μm, (G, H, J, middle panel) 100 μm, (G, H, J, right panel) 50 μm