
Figure 2. Engineering APA Isoforms.
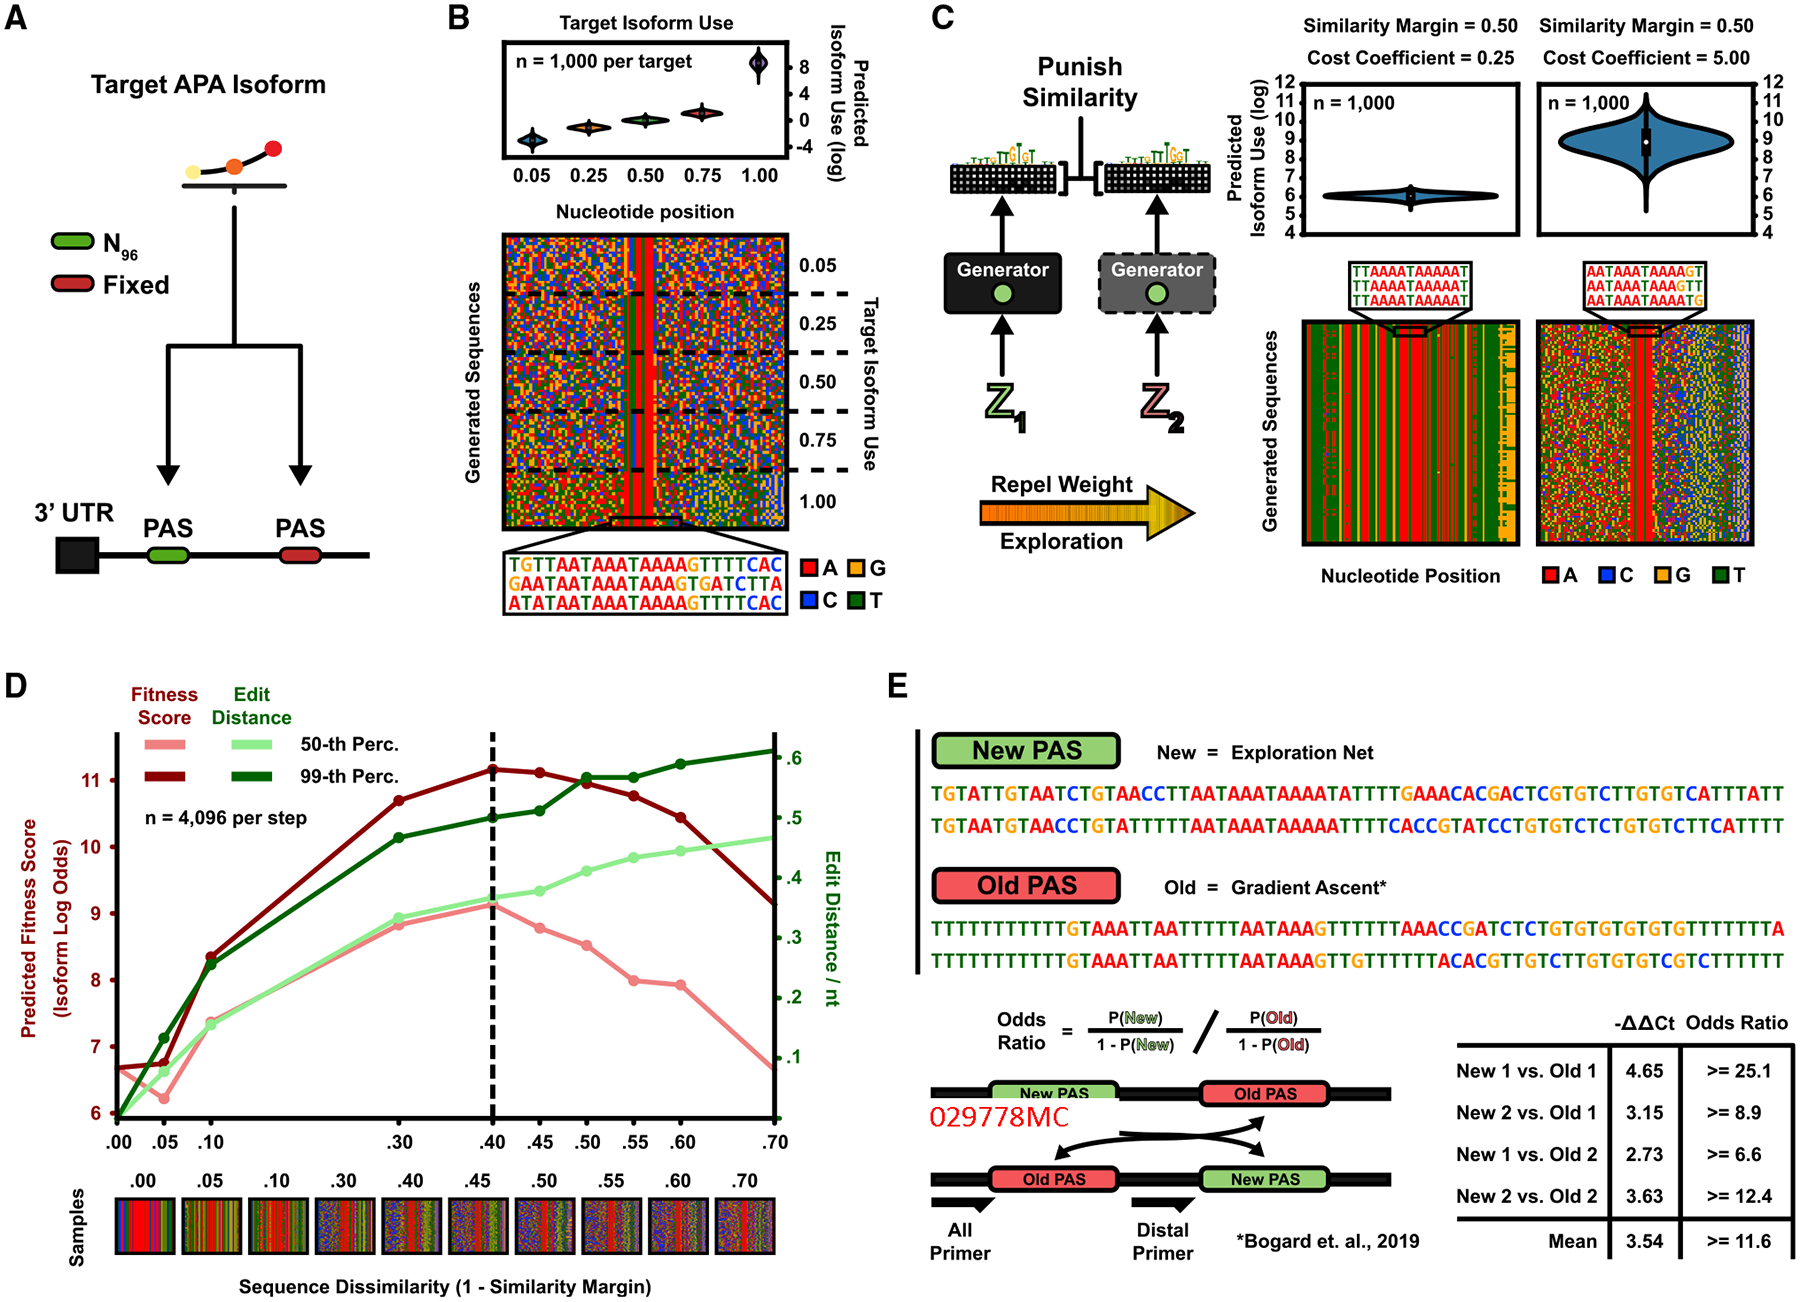
(A) Two PASs in a 3′ UTR compete for polyadenylation. The generative task is to design proximal PASs, which are selected at a target proportion.
(B) Five DENs were trained to generate sequences according to the APA isoform targets 5%, 25%, 50%, 75%, and 100% (“max”), with a sequence similarity margin (the fraction of nucleotides allowed to be identical) of 30% for the first four DENs and 50% for the max-target DEN. (Top) Predicted isoform proportions (n = 1,000 sequences per generator). Mean isoform proportion per generator (target in parenthesis): (5%) 5.25%, (25%) 25.06%, (50%) 50.6%, (75%) 74.2%, and (“max”) 99.98%. (Bottom) Pixel grid where rows denote sequences and columns nucleotide position (n = 20 sequences per generator). 0% duplication rate at 100,000 sampled sequences by any generator.
(C) The max-target DEN was re-trained with a low diversity cost coefficient (left) and a high coefficient (right). (Top) Predicted isoform proportions (n = 1,000 sequences). (Bottom) Sequence pixel grid (n = 100 sequences). Low coefficient (left): mean isoform log odds = 6.06, 99.5% duplication rate (n = 100,000 sequences). High coefficient (right): mean isoform log odds = 8.91, 0% duplication rate (n = 100,000 sequences).
(D) The max-target DEN was retrained for different values of the allowable sequence similarity margin. Plotted are the 50th/99th percentile of predicted fitness scores (isoform log odds) and pairwise normalized edit distances (n = 4,096 sequences per generator).
(E) Experiment validating the performance of the generated sequences. Two max-target sequences generated by the DEN were synthesized as either the proximal or distal PASon, a minigene reporter in competition with baseline gradient ascent-generated sequences (Bogard et al., 2019). Isoform odds ratios (preference fold changes) of the DEN PAS were assayed by using qPCR. Shown are the δδ cycle threshold values and associated odds ratios.