
Figure 3. Comparison of Sequence Design Methods.
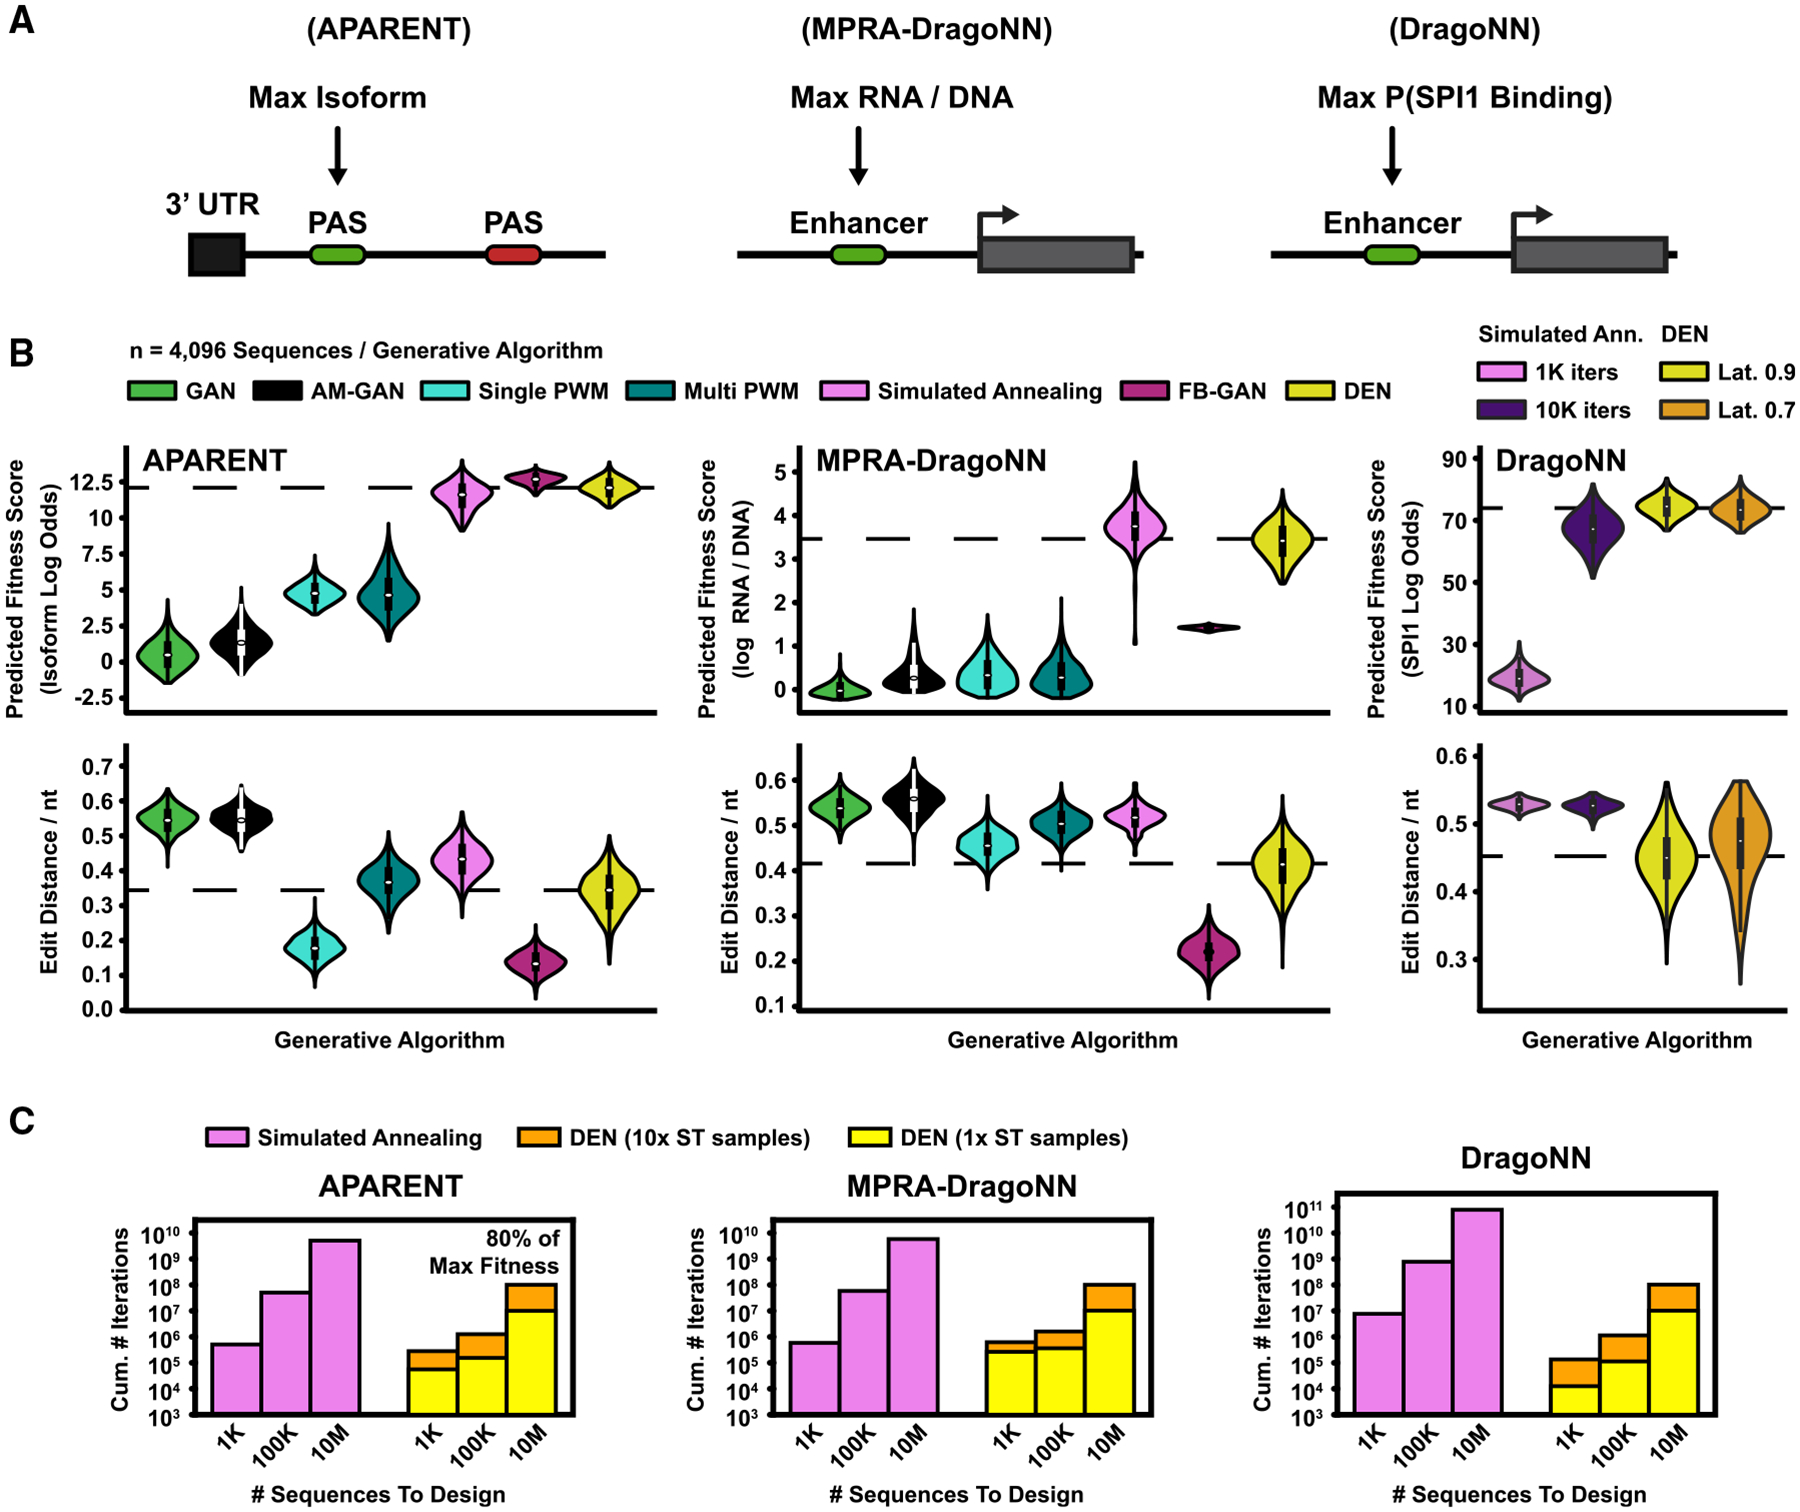
(A) Design methods were benchmarked on three tasks: (1) designing PASs with maximal isoform abundance (APARENT) (Bogard et al., 2019), (2) designing enhancer sequences for maximal transcription activity (MPRA-DragoNN) (Movva et al., 2019), and (3) designing sequences for maximal SPI1 binding (DragoNN).
(B) Seven design methods were evaluated (listed in top legend). Parametric models (GAN, FB-GAN, and DEN) were trained to convergence and subsequently used to sample n = 4,096 sequences. The GAN was trained on high-fitness data for each design task. FB-GAN and AM-GAN were based on GANs trained on a uniform subset of data. FB-GAN used an adaptive feedback threshold. DEN was trained with 50% sequence similarity margin for the first two design tasks (APARENT and MPRA-DragoNN). For the final task (DragoNN), we tried two latent penalties (70% or 90% margin). Per-sequence methods (AM-GAN, PWM Gradient Ascent, and simulated annealing) were re-initialized and optimized n = 4,096 times. (Top) Predicted fitness scores. (Bottom) Normalized pairwise sequence edit distances. Dashed lines indicate DEN median scores. See also Figures S3C–S3F.
(C) Extrapolated cumulative number of iterations (total sequence budget; y axis) required by DEN and simulated annealing to generate 1,000, 100,000, and 10,000,000 sequences (x axis) with a median predicted fitness score of 80% of the maximum value. Extrapolations were based on 960 optimized samples per method. We trained and evaluated two versions of DEN, where the number of one-hot samples used for the straight-through approximation during training was either 1 (yellow) or 10 (orange).
See also Figure S3.