
Figure 6. Engineering Differential Splicing across Organisms.
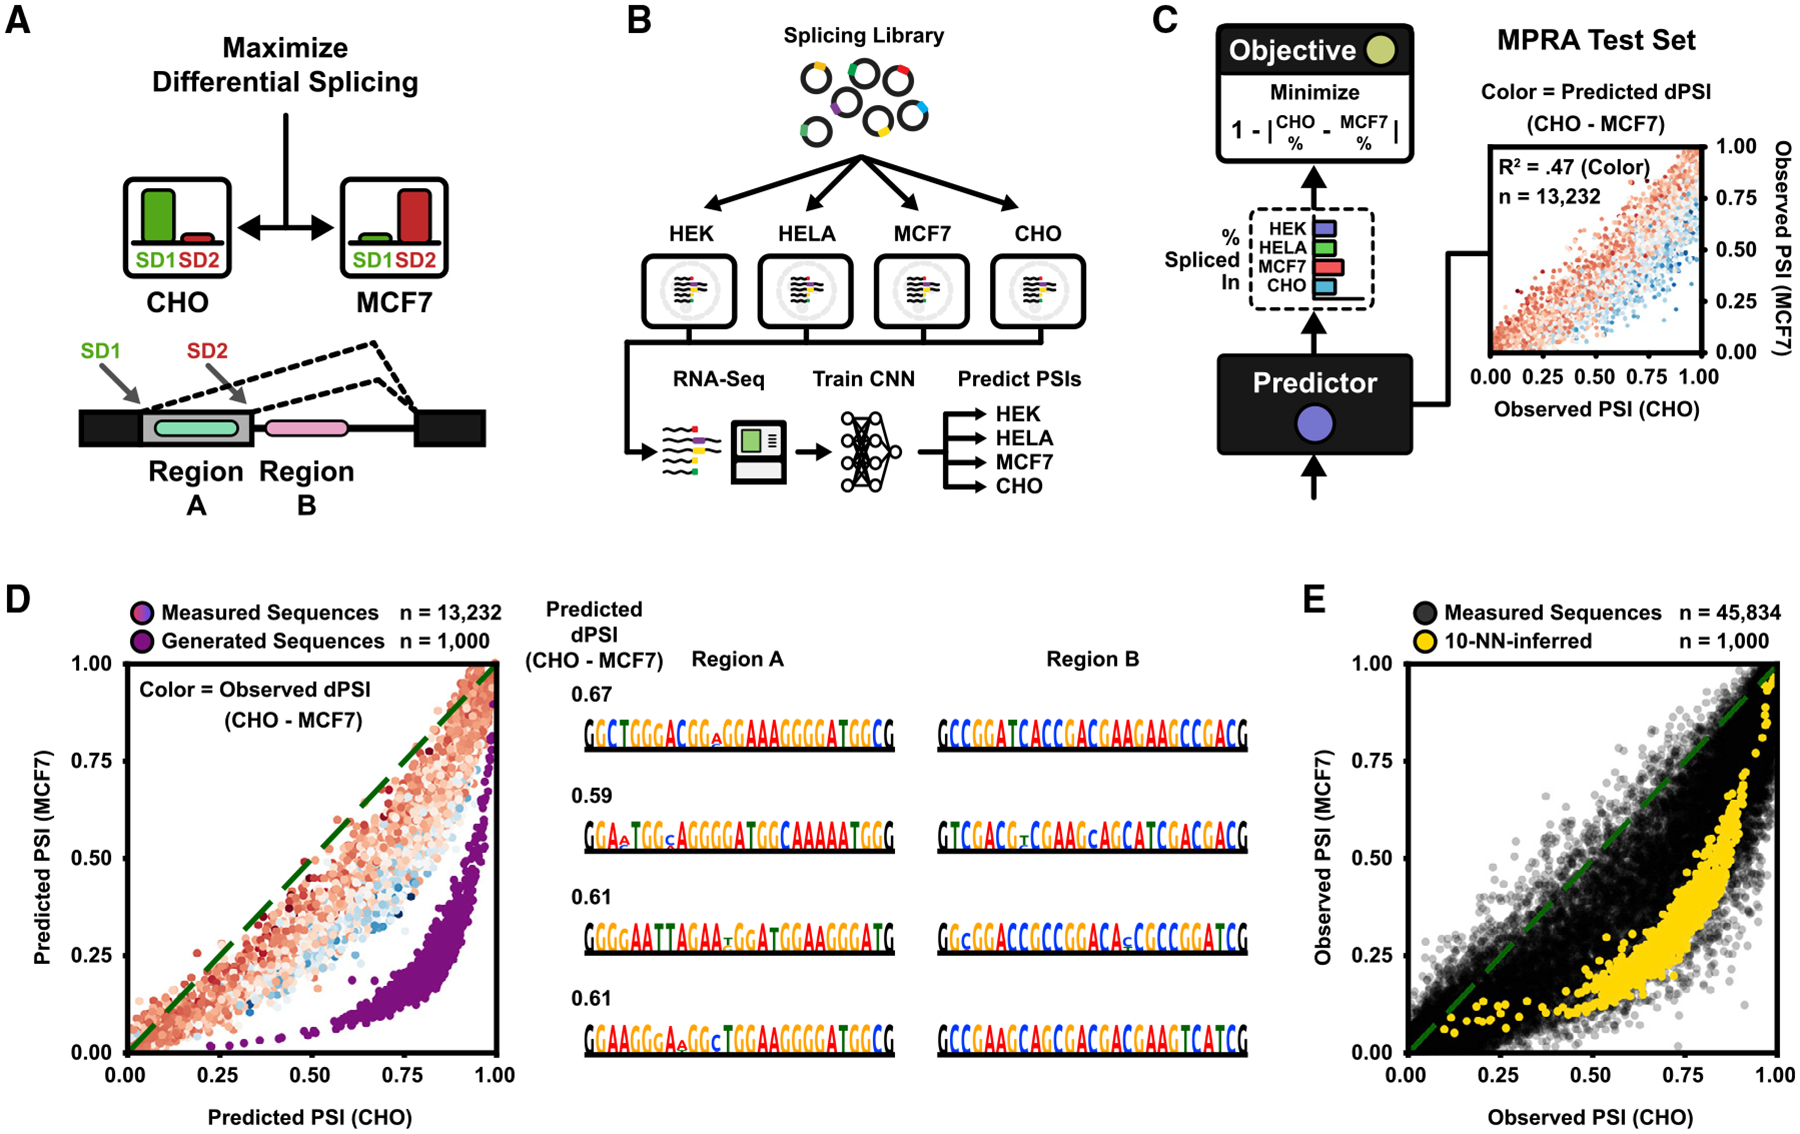
(A) Two 5′ splice donors compete for splicing. The task is to design two sequence regions, region A, which is located between the donors, and region B, which is located downstream of the 3′-most donor, to maximize differential usage (PSI) of donor 1 between two cell lines.
(B) Summary of the experimental pipeline. The MPRA of Rosenberg et al. (2015) was originally measured in HEK293 cells. Here, the library was replicated in additional cell lines HELA, MCF7, and CHO and measured by RNA-seq. A neural network (CNN) was trained on all four cell-line datasets to predict PSI per cell line given only the DNA sequence as input.
(C) (Left) The predicted MCF7 and CHO PSIs are used to maximize absolute difference. (Right) Measured MPRA test set PSIs for MCF7 and CHO. Color indicates predicted dPSI (blue or red = more or less used in CHO, respectively). Predicted versus measured delta PSI (dPSI) R2 = 0.47.
(D) The DEN was trained to maximize dPSI between MCF7 and CHO, with 50% sequence similarity margin. (Left) Predicted PSI in MCF7 and CHO for generated sequences (purple; n = 1,000). Plotted are also the predicted PSI for MPRA test sequences (color indicates measured dPSI; n = 13,232). Mean predicted dPSI of test sequences = 0.08. Mean predicted dPSI of generated sequences = 0.56. (Right) Example generated sequences. 4% duplication rate (n = 100,000 sequences). Hexamer entropy = 8.31 of 12 bits.
(E) Validation of 1,000 generated sequences against the RNA-seq measured MPRA (n = 45,834) using nearest neighbors. The first dense layer of the fitness predictor was used as feature space (256 features). Measured PSIs of the entire MPRA (black) are plotted with the interpolated PSIs of the generated sequences (yellow), estimated from 10 neighbors. Mean MPRA dPSI = 0.07. Mean dPSI of generated sequences = 0.38.
See also Figure S6.