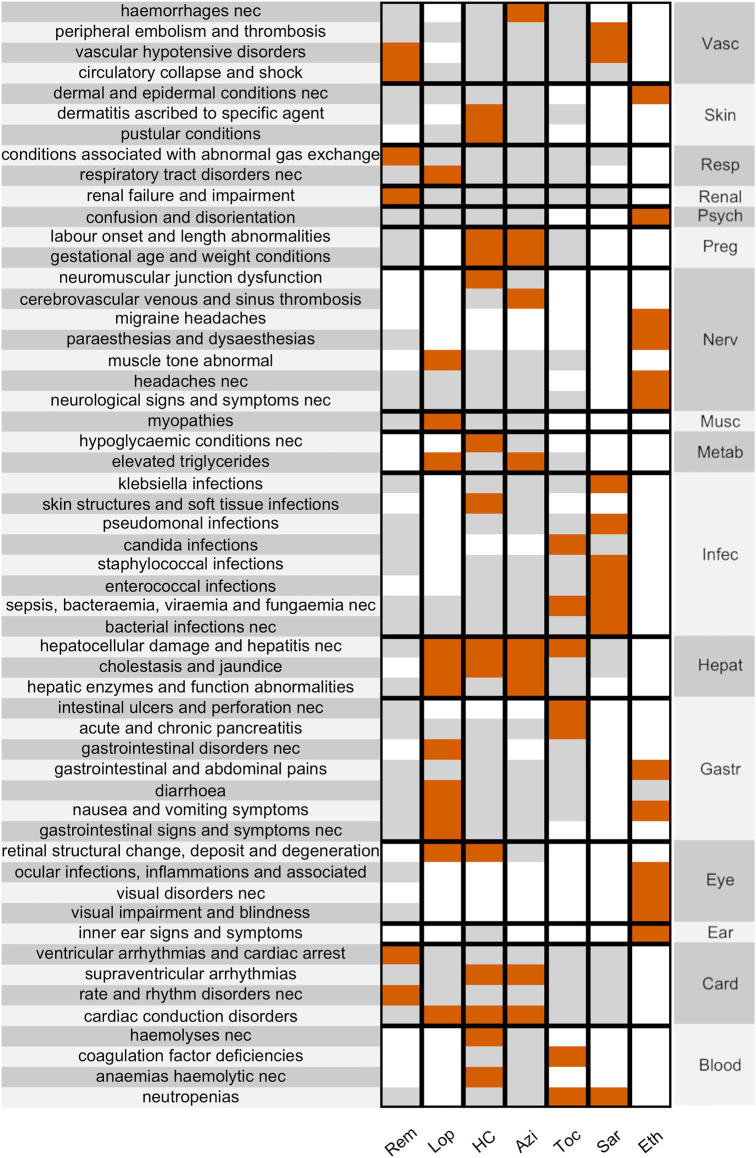
FIGURE 1.
Disproportionality Heat Map. showing significant disproportionalities (after the Bonferroni correction) between HLTs (clustered by SOC, on the right) and the main suspected drugs in COVID-19 patients. Associations are colour-coded (white when not calculated, grey when not significant, red when significant). SOCs: Vascular, Skin, Respiratory, Renal, Psychiatric, Pregnancy, Nervous, Muscular, Metabolic, Infective, Hepatic, Gastrointestinal, Eye, Ear, Cardiac, Blood. Drugs: remdesivir, lopinavir, hydroxychloroquine, azithromycin, tocilizumab, sarilumab, ethanol.

