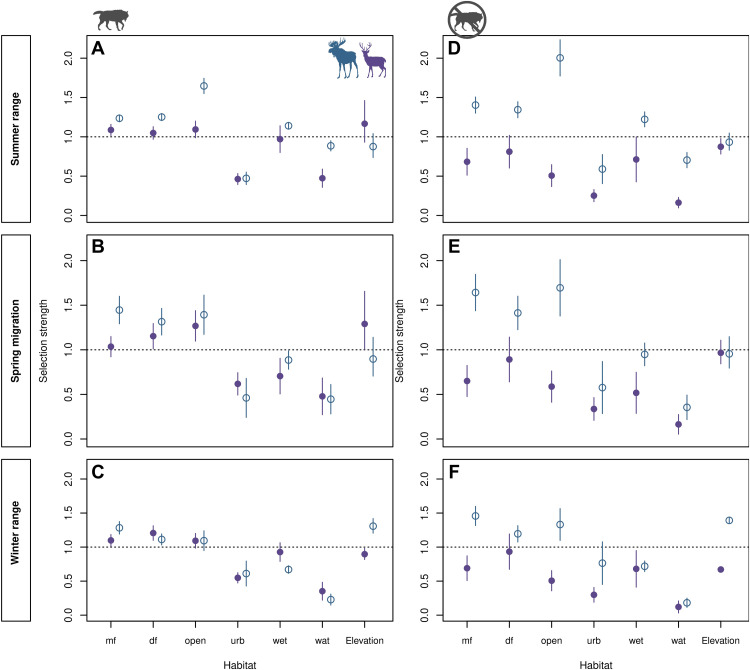
Fig. 3. Prediction of selection strength of vertebrate hosts [white-tailed deer (O. virginianus, purple) and moose (A. alces, blue)] for covertypes and elevation across seasons under two scenarios of predation risk.
Expected selection strength under average wolf predation risk in summer range (A), spring migration (B), and winter range (C). Expected selection strength under minimum wolf predation risk in summer range (D), spring migration (E), and winter range (F). Predictions for average and minimum wolf predation risk scenarios were made by fixing the wolf predation risk covariate to the average and the minimum observed across space, respectively. Selection strength (between 0 and ∞+) depicts the relative risk (odds ratio) of a moving individual to choose a given habitat, conditional on its local availability. Values above dashed line indicate that covertype was selected, while those below the dashed line indicate an avoided covertype. Open circles represent estimates for moose, and closed dots represent deer estimates. Whiskers depict 95% confidence interval of estimates. Land-cover type abbreviations: mf, mixed forest; df, deciduous forest; open, open areas; wet, wetlands; wat, water bodies; urb, urban areas.

