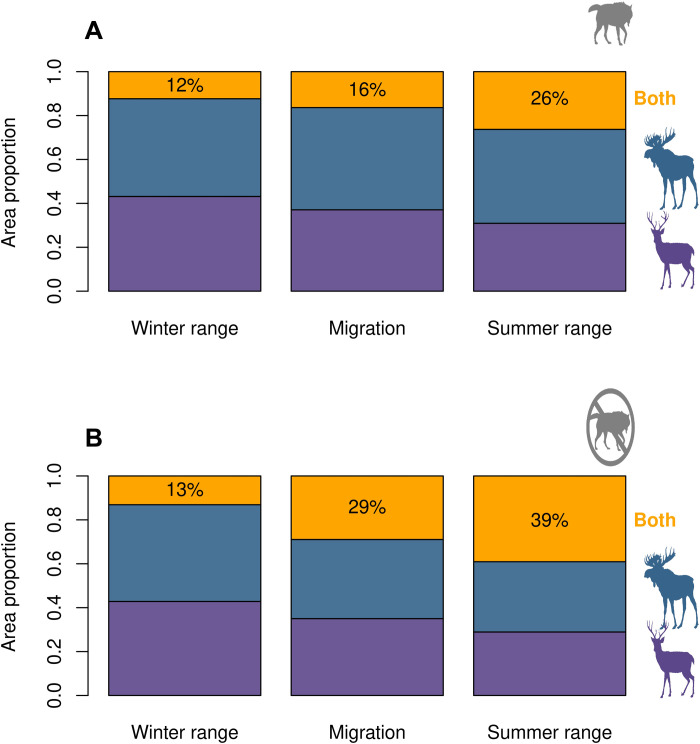
Fig. 4. Summary of spillover risk (RO50%) observed in the HSMs through time under two scenarios of wolf predation risk.
Proportion of overlap (spillover risk) and exclusive areas for deer and moose during winter range, migration, and summer range under average predation risk (A) and under minimum wolf predation risk (B). Purple, blue, and orange bars indicate deer exclusive area, moose exclusive area, and overlap area of deer and moose, respectively.

