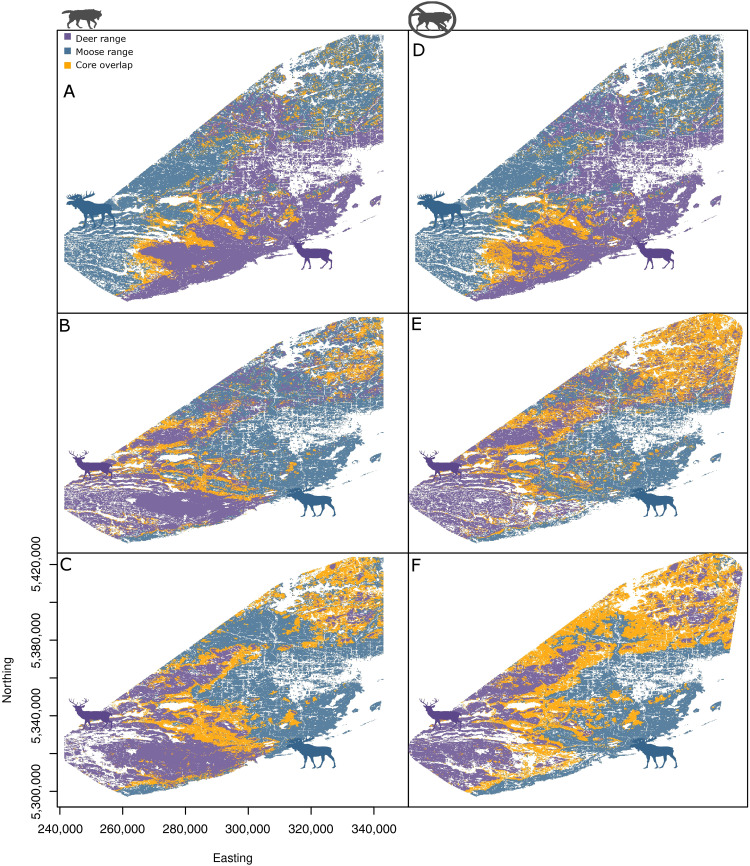
Fig. 5. HSM of vertebrate hosts [white-tailed deer (O. virginianus) and moose (A. alces)] under two scenarios of predation risk.
HSM in winter range, spring migration, and summer range from top to bottom, respectively. Left: HSM when predation risk was set as the observed values: winter range (A), spring migration (B), and summer range (C). Right: HSM when predation risk was set as the observed minimum: winter range (D), spring migration (E), and summer range (F). Purple polygons indicate HSM for white-tailed deer, blue polygons indicate HSM for moose, and orange polygons indicate the core range overlap (RO50%) between moose and deer HSMs. Continuous probability surfaces were categorized according to the isopleth of 50% of the distribution probability from each species (core range). Note that this pattern was based on disperser and migrator individuals that represent over 80% of tracked individuals.

