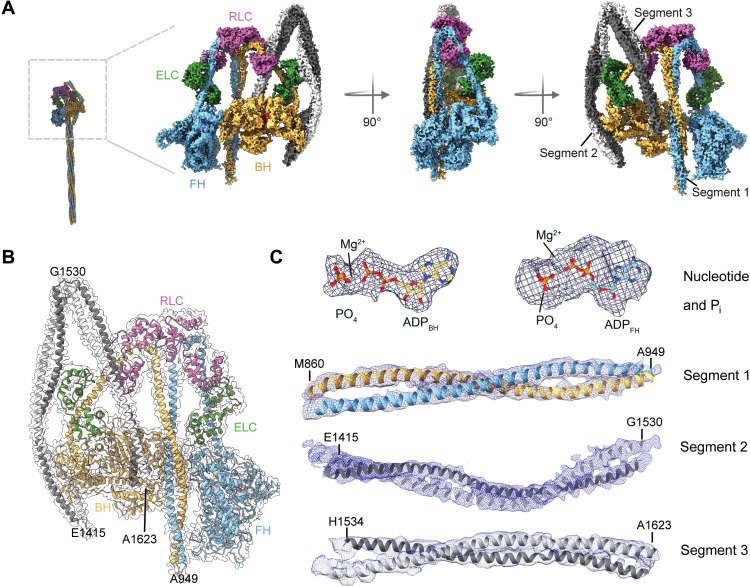
Fig. 1. Cryo-EM structure of 10S.
(A) Cryo-EM reconstruction of 10S in the front, side, and back view. Individual subunits are segmented and color-coded. The two heavy chains (blue and yellow) and bound ELC (green) and RLC (pink) are shown. (B) Atomic model of 10S fitted in the final electron density map. Individual subunits are segmented and color-coded according to (A). (C) Representative cryo-EM densities of different regions of 10S. Densities of the nucleotide (3.4 Å) and Pi displayed at 12.5 σ contour level. Densities of segment 1 (4.5 Å), segment 2 (5 Å), and segment 3 (5.5 Å) displayed at 8.0 σ contour level.

