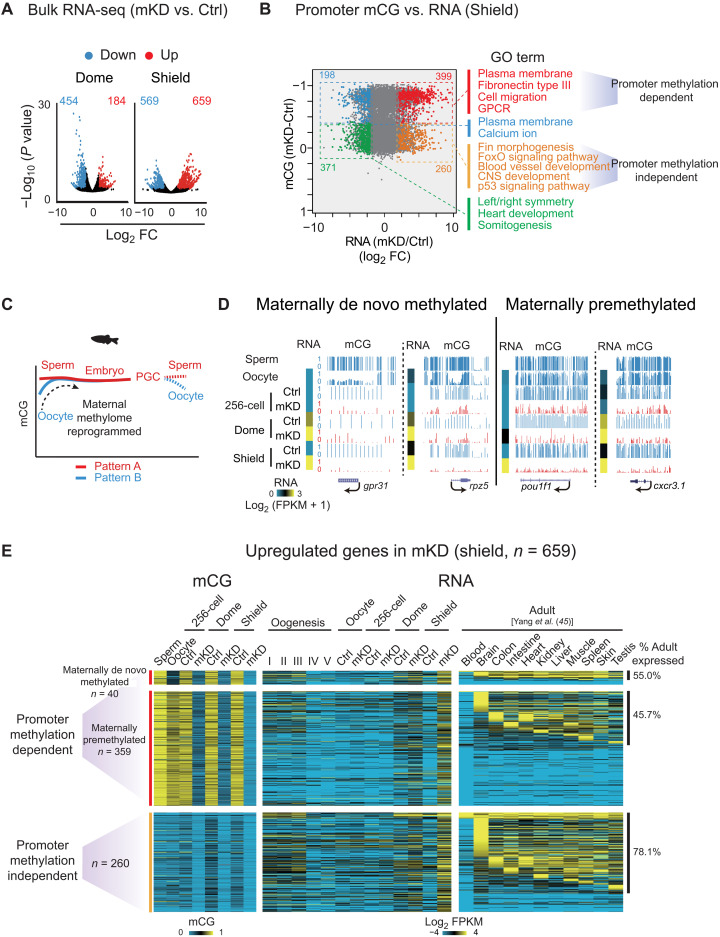
Fig. 3. Promoter DNA methylation–dependent and –independent gene derepression in mKD embryos.
(A) Volcano plots showing gene expression changes between control and dnmt1 mKD embryos at dome and shield stages. Red and blue dots indicate up-regulated and down-regulated genes, respectively. The numbers indicate counts of dysregulated genes. FC, fold change. (B) Scatter plots comparing alteration of gene expression and promoter mCG between control and dnmt1 mKD embryos at shield stage. Red and orange dots indicate promoter DNA methylation–dependent and –independent up-regulated genes, respectively; blue and green dots indicate down-regulated genes with decreased and constant promoter DNA methylation, respectively. The numbers of dysregulated genes and enriched GO terms in corresponding group (color coded) are also shown. GPCR, G protein–coupled receptor. (C) Schematic of DNA methylation reprogramming from gametes to the next generation in zebrafish. Sperm, early embryo, and PGC exhibit highly similar methylomes (pattern A) (27, 28). Oocyte has a distinct methylome (pattern B) that will be reprogrammed to pattern A after fertilization. (D) UCSC Genome Browser snapshots showing promoter mCG in sperm, oocyte, 256-cell, dome, and shield stage embryos for maternally de novo methylated [mCG(dome or shield − oocyte) > 0.4; mCG(oocyte < 0.4)] and maternally premethylated genes [mCG(dome or shield – oocyte) ≤ 0.4; mCG(oocyte ≥ 0.4)]. RNA of the 256-cell, dome, and shield stage embryos is also shown (heatmap). (E) Heatmaps showing promoter mCG and RNA expression of promoter DNA methylation–dependent or –independent genes in (B) of oogenesis, early embryos, and adult tissues (45). Promoter DNA methylation–dependent genes were further classified into maternally de novo methylated and maternally premethylated genes groups based on the mCG levels in oocyte and early embryos. The ratios of tissue expressed genes (FPKM > 5) in each group are also shown, and statistical significance for the enrichment was assessed with one-sided Fisher’s exact test.

