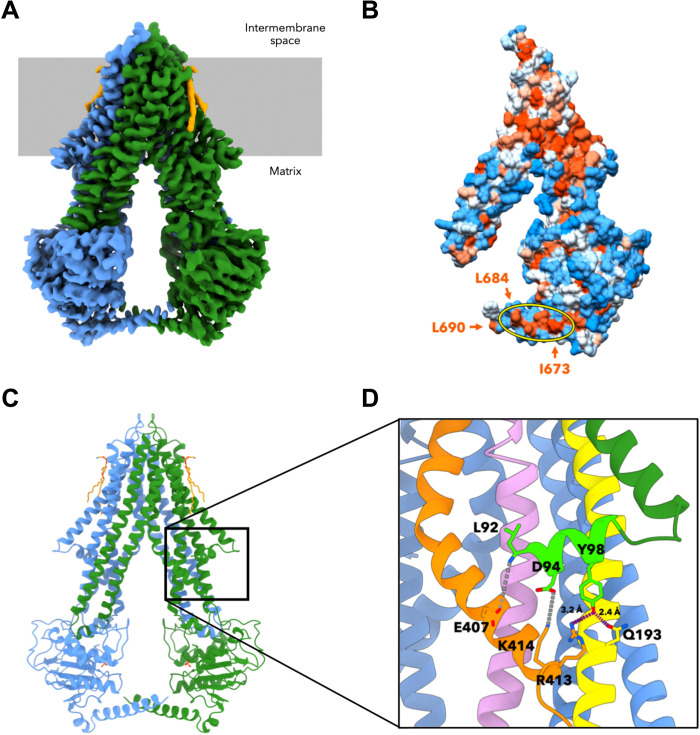
Fig. 1. Cryo-EM structure of apo-Atm1 in MSP1D1 nanodiscs.
(A) At 3.3-Å resolution, the cryo-EM map of yeast apo-Atm1 reveals an inward-facing conformation, and the densities for both monomers are represented in blue and green. The lipids are orange, and the membrane is gray. (B) Surface representation of one monomer of the cryo-EM structure colored by hydrophobicity indicating a hydrophobic patch on the C-terminal helix between I673 and L684 [arrows and yellow ellipse; structure turned by 20° with respect to (A)]. Note L690 at the end of the C-terminal helix. The hydrophobicity was calculated according to the Kyte-Doolittle scale (73) and is represented by an orange (hydrophobic) to white (neutral) to blue (hydrophilic) color gradient. (C) The atomic model built on the basis of the cryo-EM data comprises all residues from 92 to 690 [color coding as in (A)]. (D) The N-terminal elbow helix was resolved in the cryo-EM map (lime green). L92 as well as the side chains of D94 and Y98 form contacts to TM helices 2 (yellow), 3 (pink), and 6 (orange; hydrogen bonds in purple, and potential ionic bonds in gray). The structure is rotated by 35° with respect to (C).

