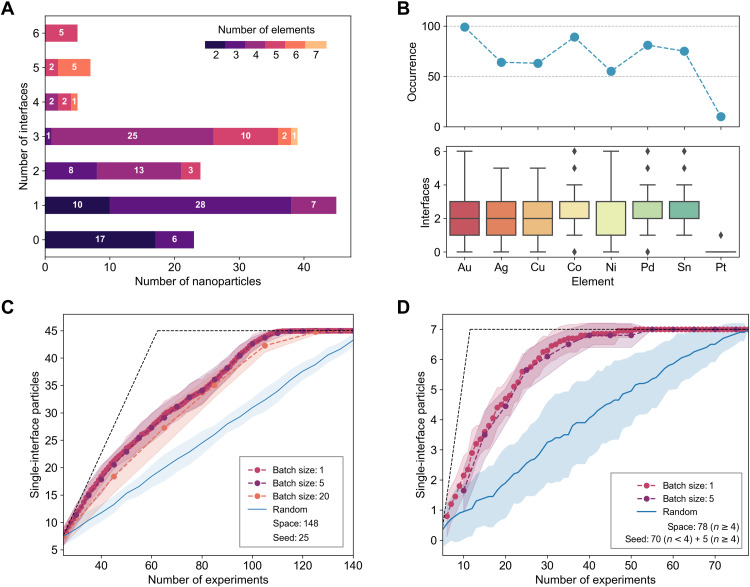
Fig. 1. Statistics of the NP dataset and simulated optimization campaigns.
(A) Distribution of the interface counts in the initial N = 148 NP dataset. Each interface count is broken down into segments on the basis of the number of elements making up the particle. (B) Occurrence of each of the eight elements in the initial dataset and the corresponding interface count box plots for each element. Performance results for the acquisition algorithm targeting single-interface particles, simulated using the existing dataset under two different scenarios in (C) and (D), at different batch sizes and compared to the random acquisition baseline. The performance (C) with a seed of 25 randomly selected particles from the space of 148 available, with the remaining space searched by the algorithm to find single-interface particles, and (D) with a seed made of 70 particles with n < 4 elements and 5 randomly selected from those with n ≥ 4, with the remaining space searched by the algorithm to find single-interface particles with n ≥ 4. Dashed lines show ideal performance limits and shaded regions show variability, limited to ± σ for visual clarity.

