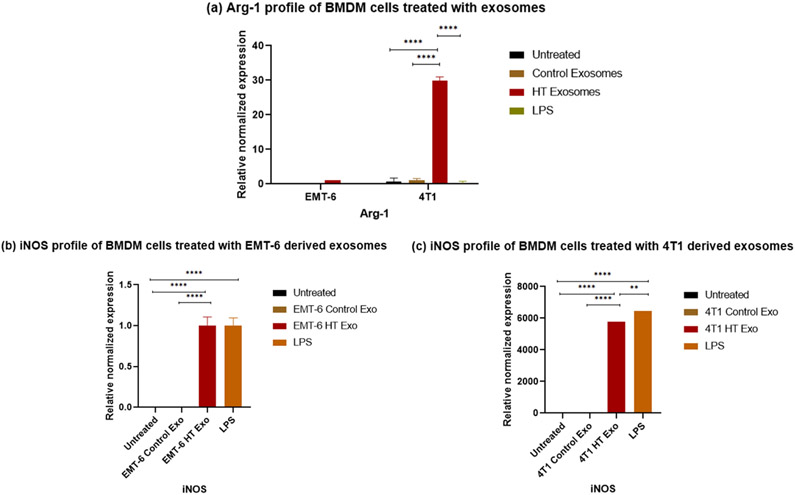
Figure 9.
qRT-PCR profile of macrophage polarization marker expression (normalized to GAPDH) in BMDMs following the exposure to control exosomes or exosomes derived from 4T1 and EMT-6 cells exposed to hyperthermia. (a) Arg-1 profile of BMDM cells following 24 hours exposure to control and hyperthermia based exosomes from 4T1 and EMT-6 cells respectively, (b-c) iNOS profile of BMDM cells after 24 hours exposure to control exosomes or exosomes derived from 4T1 and EMT-6 cells exposed to hyperthermia. The Arg-1 and iNOS expression level in untreated control and EMT-6 control exosomes treated BMDM cells in (a,b) is close to zero and hence not visible in the graph. Similarly iNOS expression level is negligible in untreated control and 4T1 control exosome treated BMDM cells in (c) and hence not visible in the graph. One-way ANOVA followed by Tukey's test was used for comparing data between groups, where * indicates p <0.05, ** indicates p <0.01 and *** indicates p <0.001 between bracketed groups (n=3).

