. 2021 Jan 28;11(10):5384–5392. doi: 10.1039/d1ra00110h

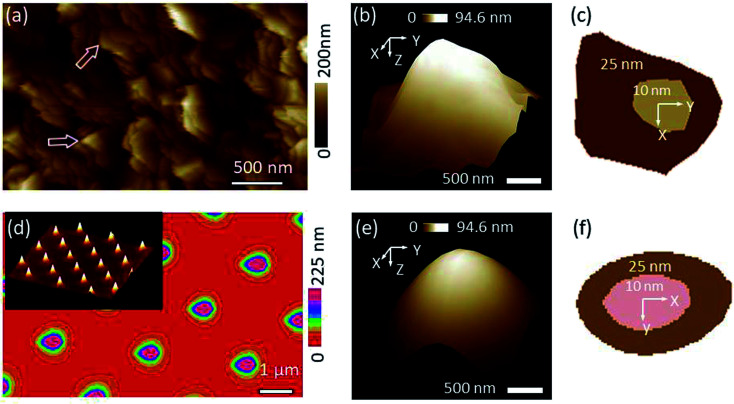
Fig. 2. (a) Roughness image obtained by scanning a sharp SNL probe against titanium sample, (b) 3-D view of the tip that was blind tip reconstructed based on the rough pattern in (a), (c) 2-D sections of the tip at (b) at two Z levels (inner at Z = 10 nm and outer at Z = 25 nm starting from the tip apex as an origin), (d) roughness image obtained by scanning a Tap150A probe against TGT1 grating sample. The inset shows 3-D view of the TGT1 spikes, (e) and (f) are the same as (b) and (c) by analyzing (d) image. Using the grating yields better tip reconstruction in terms of the smoothness of the tip shape (e), however, leads to more elongated profile (f) compared to tip obtained at the titanium sample (b) and (c), respectively.

Fig. 2