FIG. 1.
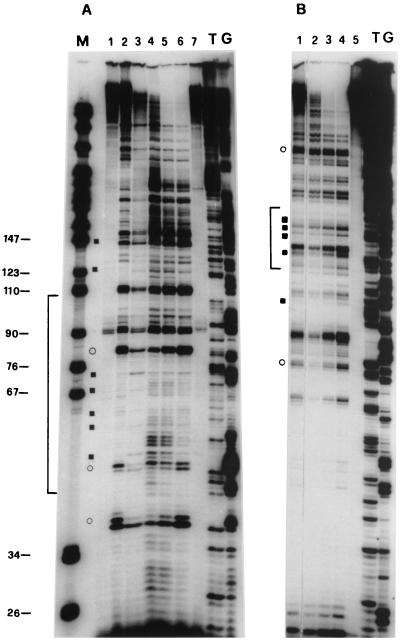
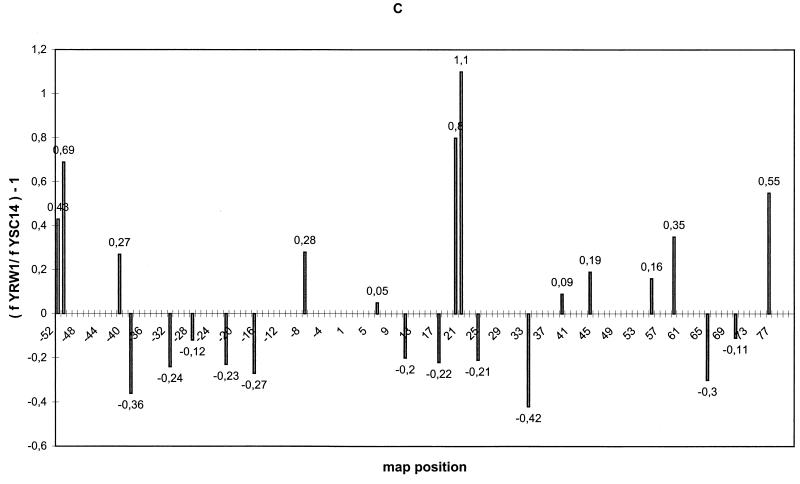
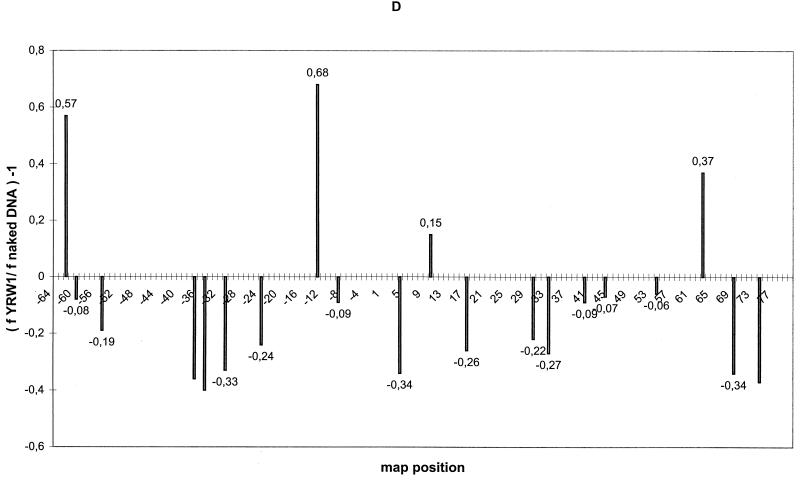
UV footprinting on exponentially growing S. cerevisiae YRW1 and YSC14 cells. (A) Samples treated as described in Materials and Methods were primer extended with Taq polymerase (94°C for 45 s, 60°C for 1 min, and 72°C for 2 min for 30 cycles) using primer A (Fig. 3). After phenol extraction and ethanol precipitation, samples were analyzed on a 6% denaturing polyacrylamide gel. M, PBR322 MspI marker lane. The band length in base pair is indicated on the side. Lanes: 1, nonirradiated naked genomic DNA from strain YRW1; 2, genomic DNA from 8-min-irradiated strain YRW1; 3, genomic DNA from 8-min-irradiated strain YSC14; 4 to 6, naked genomic DNA irradiated for 30 s, 1 min, and 3 min, respectively; 7, unirradiated naked genomic DNA from strain YSC14; T and G, Sanger T and G sequencing lanes. Empty circles indicate selected increased pausing sites (enhancements) in strain YRW1 relative to strain YSC14; solid squares indicate selected decreased pausing sites (protections) in strain YRW1 relative to strain YSC14. The bracket indicates the position of the TFIIIB binding site. (B) Samples treated as described in Materials and Methods were primer extended with Taq polymerase (94°C for 45 s, 60°C for 1 min, and 72°C for 2 min for 30 cycles) using primer B (Fig. 3). After phenol extraction and ethanol precipitation, samples were analyzed on a 6% denaturing polyacrylamide gel. Lanes: 1, genomic DNA from 8-min-irradiated strain YRW1; 2 to 4, naked genomic DNA irradiated for 30 s, 1 min, and 3 min, respectively; 5, nonirradiated naked genomic DNA from strain YRW1; T and G, Sanger T and G sequencing lanes. Empty circles indicate selected increased pausing sites (enhancements) in strain YRW1; solid squares indicate selected decreased pausing sites (protections) in strain YRW1. The bracket indicates the position of the TFIIIB binding site. (C) Quantitation of the data in panel A. The intensity of UV-induced pausing sites was quantitated by scanning densitometry (see Materials and Methods). The x axis gives the site position in the gene sequence (Fig. 3); the y axis gives (f YRW1/ f YSC14) −1, where f is the band intensity, normalized to the total intensity of the scanned lane segment (from positions −52 to +77 in the gene). For YRW1 and YSC14 we used lanes 2 and 3, respectively. Negative numbers indicate protections; positive numbers indicate enhancements. (D) Quantitation of the data in panel B. The x axis gives the site position in the gene sequence (Fig. 3); the y axis gives (f YRW1/ f naked DNA) − 1, where f is the band intensity, normalized to the total intensity of the scanned lane segment (from positions −64 to +77 in the gene). For YRW1 and naked DNA we used lanes 1 and 3, respectively. Negative numbers indicate protections; positive numbers indicate enhancements. Data are the average of two independent experiments; ς = 0.092.


