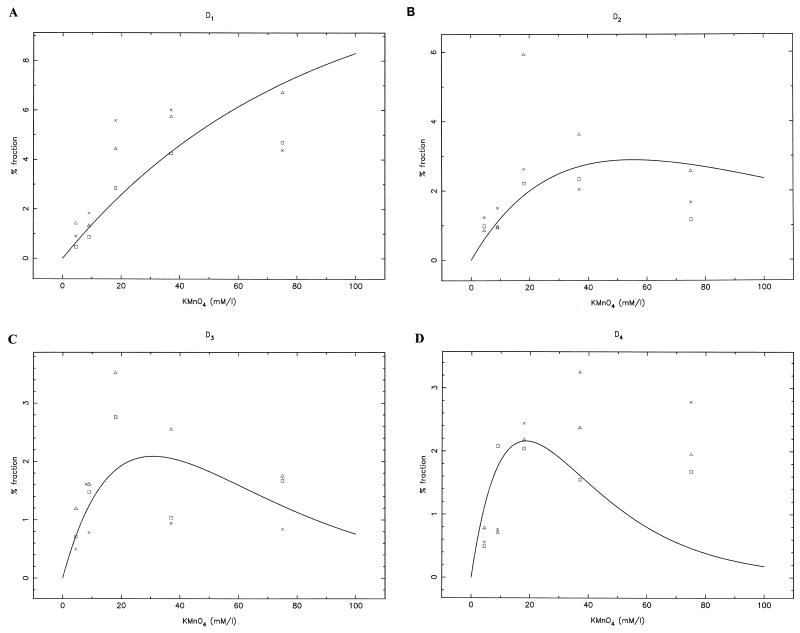
FIG. 6.
Quantitative analysis of KMnO4 titration on S. cerevisiae YRW1 cells. Shown are plots of the KMnO4-induced pausing fraction versus reagent concentration (see Materials and Methods) for D1 (A), D2 (B), D3 (C), and D4 (D). Data from three independent experiments are shown. The theoretical curves are the best global fit of the data (to equations 2 to 5 [see Materials and Methods]).

