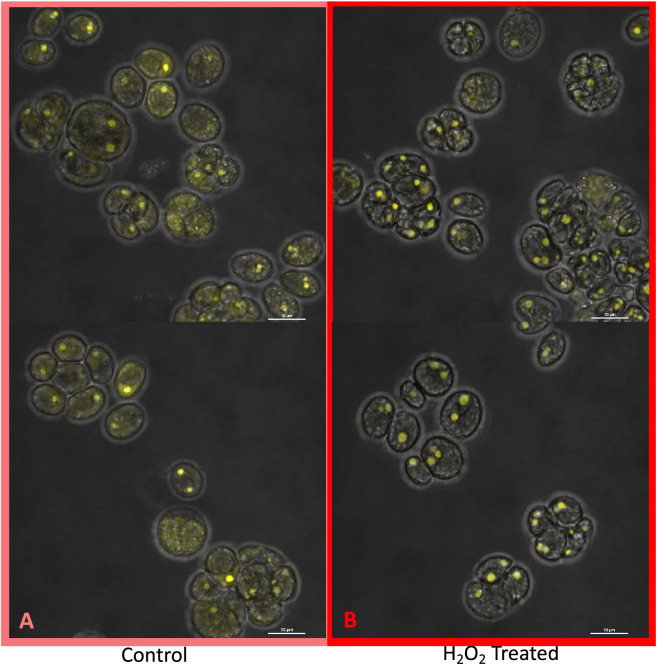
Appendix 1—figure 17. Localization of rubisco, control cells (Panel A) and cells exposed to 100 μM H2O2 (Panel B), visualized by the Nikon A1 Confocal Laser Scanning Confocal Microscope confocal microscopy, in strain CC-5357, containing at RBCS1-Venus tag.
Scale bar = 10 μm. These images, along with those with the Olympus (Figure 6), indicate a clear change in rubisco localization, rather the simply a change in rubisco amount. Since confocal microscopy is designed to acquire a very thin optical section through the thickness of a single cell, it can be difficult to use confocal fluorescence microscopy to accurately measure total protein content within the 3-dimensional volume of a single cell. Acquisition of several images through the thickness of the cell may actually over estimate or under estimate the total fluorescence intensity, depending on the Z-step increment. However, when comparing these images of Venus Fluorescent Protein-labeled rubisco within Chlamydomonas cells acquired using the Nikon A1 confocal microscope, the fluorescence intensity of the pyrenoid matrix of most cells under control conditions (5 mM bicarbonate, no H2O2 treatment) was similar to or dimmer than the fluorescence intensity of the pyrenoid matrix within cells treated for six hours with 100 μM H2O2. In contrast, the fluorescence intensity of the Venus Fluorescent Protein-labeled rubisco located outside of the pyrenoid matrix was measurably higher in cells under control conditions compared to H2O2-treated cells. If the decrease in Venus Fluorescent Protein-labeled rubisco fluorescence located outside of the pyrenoid matrix in H2O2-treated cells was due to an overall decrease in rubisco production within the cell and not due to delocalization of the protein from the pyrenoid to the cytoplasm of the cell, then fluorescence intensity of the pyrenoid within H2O2-treated cells should show a comparable decrease in fluorescence intensity, which is not seen. Fluorescence was detected using 0.5 % 514 nm diode laser intensity. Fluorescence emission was recorded through 565/70 nm band pass filter using a Gallium Arsenide Phosphide (GaASP) detector (High Voltage = 47, offset –7).

