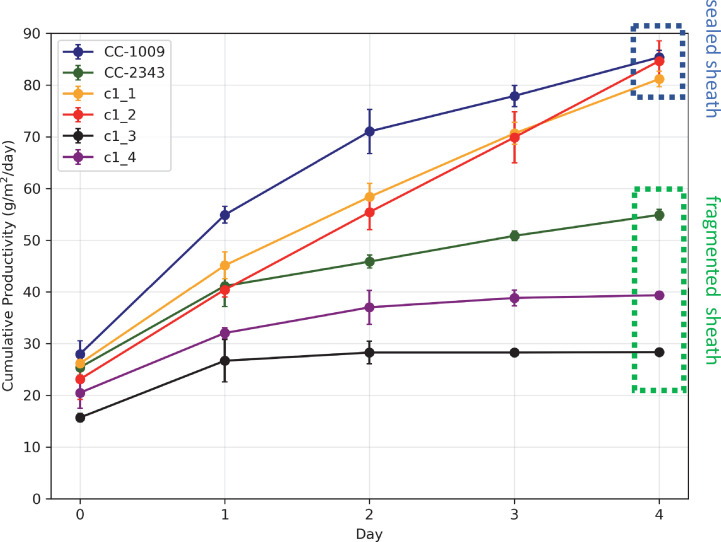
Figure 3. Cumulative biomass productivity following switching the bioreactors over to hyperoxia at dawn on day 0.
Strains CC-1009, c1_1, and c1_2, which all showed continuous, sealed pyrenoids at 6 hours (see Figure 2A) all continued to accumulate biomass after three days of hyperoxia, while CC-2343, c1_3, and c1_4, which had fragmented, porous pyrenoid (Figure 2B) structures, did not, with daily productivities hovering at zero. Visual inspection (via light microscopy) also revealed that the cultures of the intolerant lines by day 3 consisted of severely stressed or dead cells, while the tolerant lines showed cells with continued viability. Prior to exposure to hyperoxia, cultures were grown at steady state (with 5 % CO2 with 14:10 hr (light:dark) sinusoidal illumination with peak light intensity of 2000 μmoles m–2 s–1, in minimal 2NBH media) and at Day 0, the gas was switched to hyperoxia not at midnight but at dawn. Even at steady state, c1_3 had lower growth than the other strains, although this was not true when grown at other conditions (i.e. see Appendix 1—figure 7). Error bars represent standard deviation for three separate reactor experiments. By day 3, c1_3 always ceased growth. Even though productivities had just begun to decline at 6 hr, the pyrenoid structure (i.e. sealed vs. porous Figure 2) paralleled the eventual tolerances.

