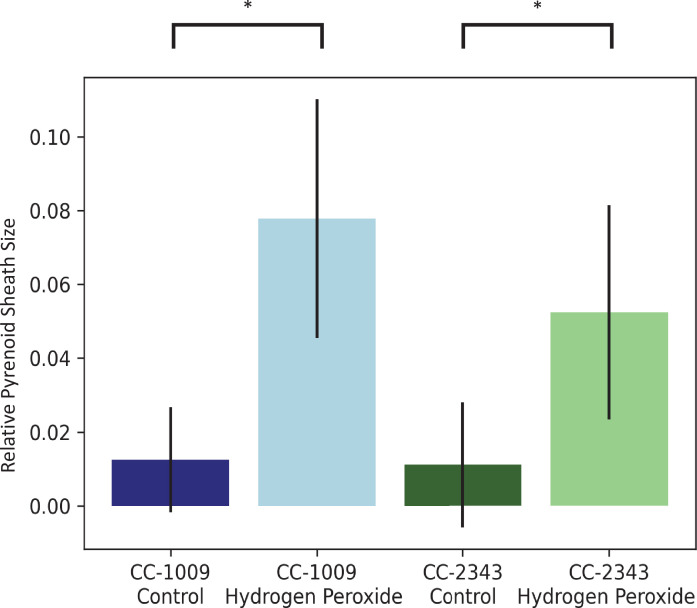
Figure 5. Image J Analysis of CC-2343 and CC-1009 cells, control (green, blue) and exposed to H2O2 (light green, light blue), normalized to cell size.
In response to pre-treatment with H2O2, pyrenoid sheath size increased. Relative pyrenoid sizes were estimated using the ImageJ program by measuring the visible projected areas of starch sheath in TEM images and compared to that of the projected areas of the cells. Error bars represent the standard deviation between the approximately 30 cells analyzed (See Figure 4 and Transparent Reporting Image 7-10). * p < 0.001.

