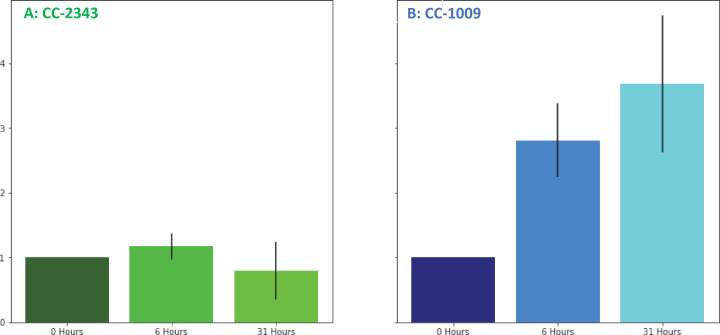
Figure 8. Changes in H2O2 in cellular extracts upon exposure to hyperoxia.
Cells of CC-2343 (Panel A) and CC-1009 (Panel B) were rapidly broken and extracts assayed using the Amplex Red method just prior to (0 hr) and at 6 and 31 hr exposure to 95 % O2, 5 % CO2, as described in Materials and methods. Values shown are normalized to those taken at 0 hr, when the values normalized to the extract’s protein contents were 3.37 μM for CC-2343 (Panel A) and 0.456 μM for CC-1009 (Panel B). Error bars represent the standard deviation among three biological replicates.

