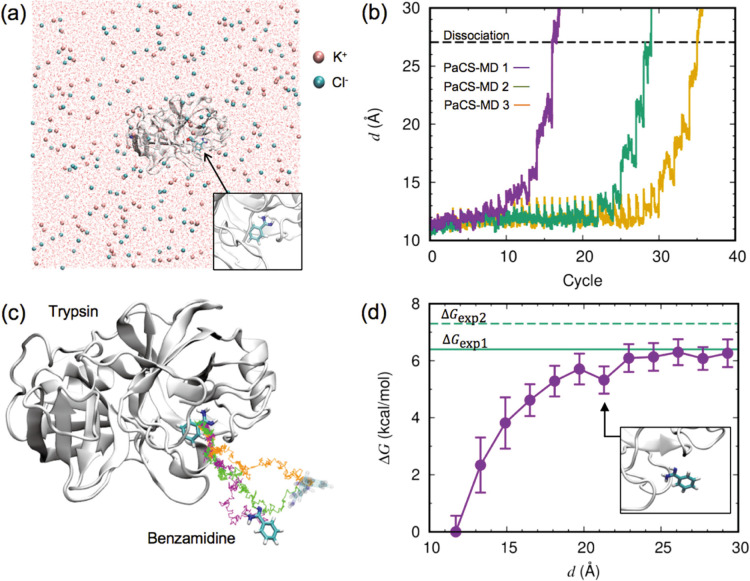
Figure 1 .
Binding free energy calculation for the trypsin/benzamidine complex. (a) Initial configuration of the complex, ions, and water oxygen in the simulation box. A close-up view of benzamidine with trypsin is shown in the inset. (b) The distance between the center-of-mass (COM) positions of trypsin and benzamidine, d, plotted as a function of the PaCS-MD cycles. Three independent simulations are shown in different colors. The dashed line indicates the average value of d where the complex totally dissociated. (c) Representative dissociation pathways of benzamidine from trypsin obtained by PaCS-MD simulations. Colored lines show the trace of the benzamidine COM position along representative concatenated trajectories. Colors are the same as in (b). The initial and final structures of benzamidine in the first PaCS-MD trial are shown in the stick model, and in transparent color for the other trials. (d) Free energy profile against d calculated by PaCS-MD/MSM. The error bars indicate the standard deviation of three PaCS-MD/MSM trials. Green lines indicate the experimentally determined values of the binding free energy. The inset shows a close-up view of a benzamidine structure with d=21.1 Å In this paper, the molecular structure was visualized using VMD [64].

