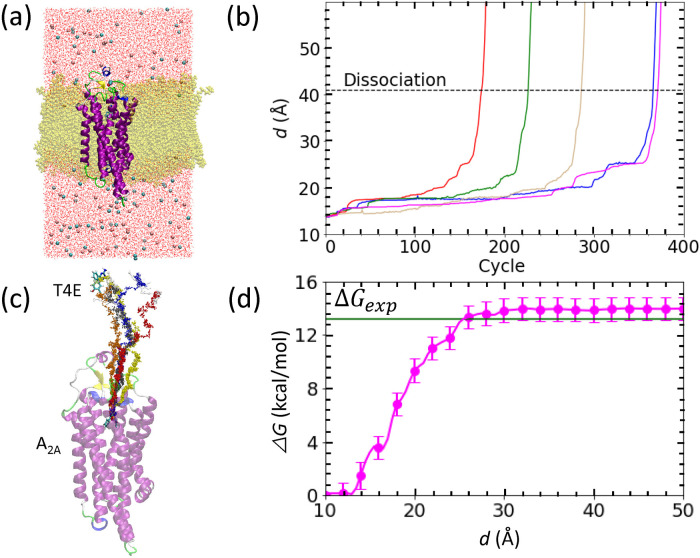
Figure 3 .
Binding free energy calculation for the adenosine A2A/T4E complex shown in a similar manner to that for the trypsin/benzamidine complex in Fig. 1. (a) Configuration of the simulated system after careful relaxation. The protein is shown in a cartoon representation while the T4E ligand (atom-type coloring) and lipid membrane (yellow) are shown as licorice models. The pink and cyan spheres represent chloride and sodium ions, respectively, and water molecules are shown as line representations with atom-type coloring. (b) Evolution of d against the PaCS-MD cycles. (c) Unbinding pathways obtained by five PaCS-MD simulations. (d) The inter-COM free energy profile from five independent PaCS-MD/MSM calculations. The experimentally determined binding free energy is indicated by a green line. The inset of panel (d) displays the binding to the entrance of binding pocket of T4E.

