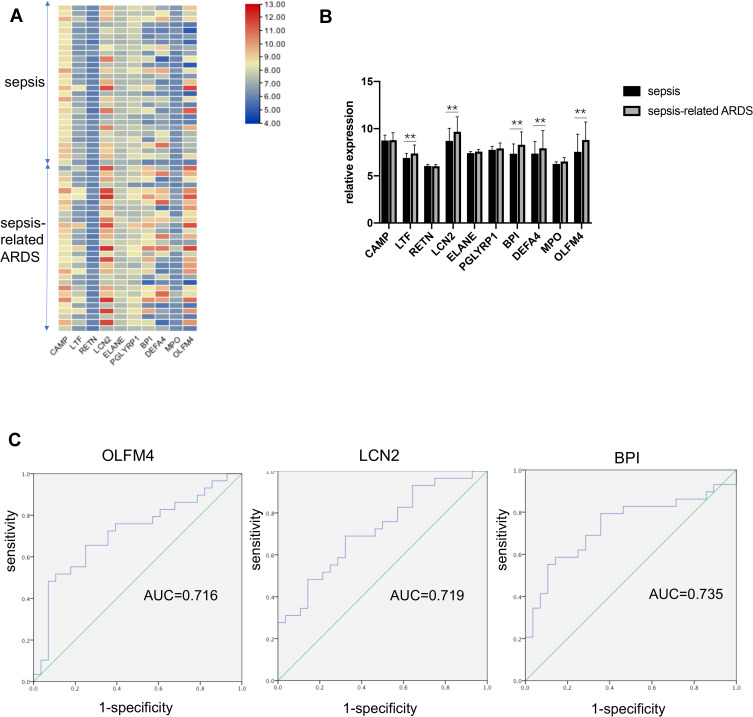
Figure 2.
OLFM4 expression was different between septic and sepsis-induced ARDS patients. (A and B) Heatmap and statistical analyses of expression of the ten hub genes in the GSE66890 dataset. Red = upregulated. Blue = downregulated. **p < 0.01. (C) Analyses of ROC curves of critical DEGs in the GSE66890 dataset. ROC curves were generated and the area under the ROC was used to compare the ten genes in the sepsis group and sepsis-related ARDS group. Three DEGs showed AUC >0.7: 0.716 for OLFM4, 0.719 for LCN2, and 0.735 for BPI.

