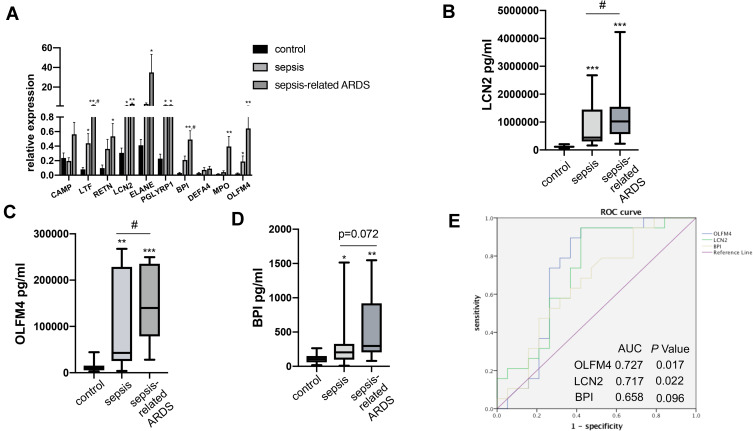
Figure 3.
Validation of OLFM4 expression at the transcriptional and protein level. (A) Expression of ten critical genes was compared between healthy controls, septic patients, and sepsis-related ARDS patients by quantitative real-time PCR. Differences between two groups were analyzed. *p < 0.05, **p < 0.01 versus CT group, #p < 0.05 versus sepsis group. (B, C and D) Plasma OLFM4, LCN2 and BPI expressions were compared between healthy controls, septic patients, and sepsis-related ARDS patients using ELISA kit. **p < 0.01 versus control group, ***p < 0.001 versus control group, #p < 0.05 versus sepsis group. (E) Analyses of ROC curves of plasma OLFM4, LCN2 and BPI expression. ROC curves were generated and the area under the ROC was used to compare plasma OLFM4, LCN2 and BPI expressions in the sepsis group and sepsis-related ARDS group.

