
Figure 2.
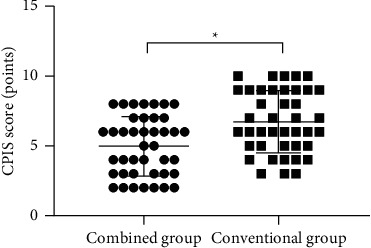
Comparison of CPIS scores of children after treatment between the two groups ( ± s). The horizontal axis indicates the combined group and the conventional group, and the vertical axis indicates the CPIS score (points); after treatment, the mean CPIS scores of children in the combined group and the conventional group are (4.46 ± 2.03) and (6.37 ± 2.19), respectively. ∗After treatment, the mean CPIS scores of children in both groups are significantly different (t = 4.096, P < 0.05).