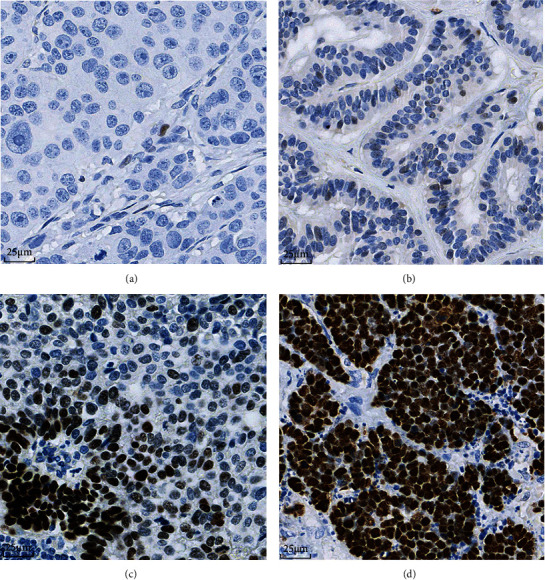
Figure 2.

Different patterns of p53 expression in GI-NENs. (a) Pattern A showed completely absent p53 expression of tumor cell nucleus. Note that scattered stromal cells were weakly positive for p53 (40x). (b) Pattern B showed p53 expression in 1%-20% of tumor cell nuclei with weak intensity (40x). (c) Pattern C1 showed a variable staining intensity with focal tumor cell nests demonstrating strong positivity (40x). (d) Pattern C2 was accompanied by diffuse (61%-100%) and strong nuclear staining (40x).
