
Fig. 5.
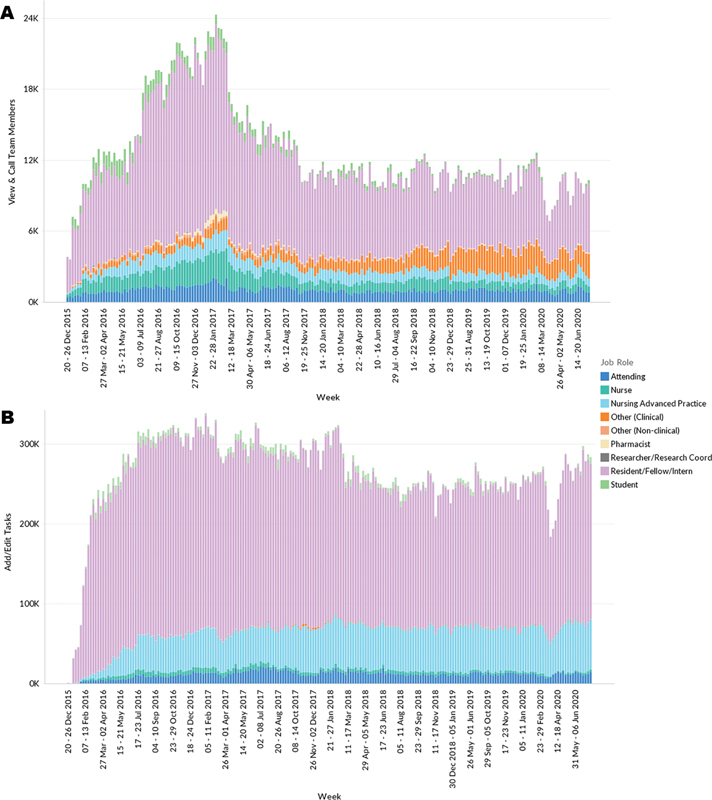
Communication and task management. Panel ( A ) shows the number of times per week that users used Carelign to view care team information or generate phone calls from within Carelign. This decreased since the implementation of EpicCare Inpatient in 2017 but has remained steady since. Panel ( B ) shows the number of times per week that users added or edited tasks within Carelign. These numbers have remained steady since implementation (except for the months corresponding to the first Spring 2020 surge of the COVID-19 pandemic). Note: Due to errors in data collection, login sessions for the following date range were omitted from panel (A) (05/24/2016–06/04/2016, 09/10/2017–11/04/2017, 12/17/2017–12/23/2017, and 01/13/2019–04/13/2019) and panel (B) (05/24/2016–06/04/2016, 12/17/2017–12/23/2017, and 01/13/2019–04/13/2019).