Abstract
In recent years, imaging-guided photothermal tumor ablation has attracted intense research interest as one of the most exciting strategies for cancer treatment. Herein, we prepared polydopamine and graphene quantum dot-capped Prussian blue nanocubes (PB@PDA@GQDs, PBPGs) with high photothermal conversion efficiency and excellent fluorescence performance for imaging-guided cancer treatment. Transmission electron microscopy (TEM), UV-vis absorption spectroscopy (UV-vis), fluorescence spectroscopy, and X-ray photoelectron spectroscopy (XPS) were employed to characterize their morphology and structures. The photothermal conversion efficiency and therapeutic effect were evaluated in vitro and in vivo. Results revealed that this nanoagent had excellent biocompatibility and enhanced the photothermal effect compared to blue nanocubes (PBs) and polydopamine-capped Prussian blue nanocubes (PB@PDA, PBPs). Therefore, our study may open a new path for the production of PB-based nanocomposites as theranostic nanoagents for imaging-guided photothermal cancer treatment.
Polydopamine and graphene quantum dot-capped Prussian blue nanocubes with fluorescence and enhanced photothermal conversion properties were prepared, and have been successfully used for the fluorescence imaging-guided photothermal therapy of tumors.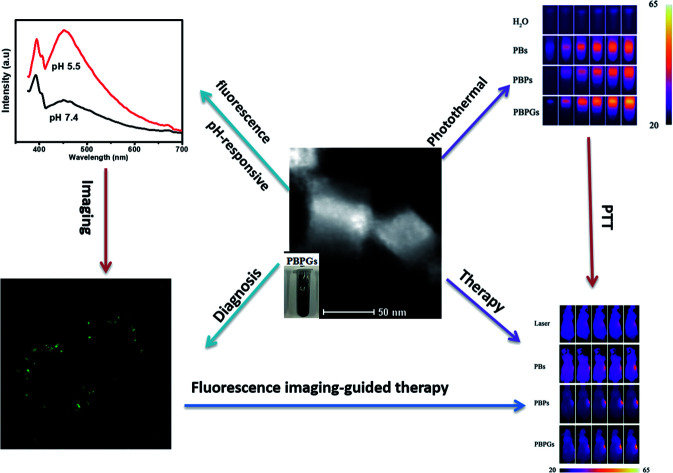
1. Introduction
Cancer is one of the most fatal health problems worldwide, thereby forcing researchers to look for effective diagnosis and treatments.1,2 However, routine single diagnostic or therapeutic methods for cancer are not efficacious and often result in unsatisfactory therapeutic effects, such as damage to normal tissues and drug resistance. Designing an intelligent nanocarrier integrating multifunctional diagnostic and therapeutic methods has attracted broad attention in cancer therapy.3–6 Tremendous efforts have been devoted to developing new ways for cancer diagnosis and therapy.7,8 Theranostic nanoagents, integrating diagnostics, and therapeutic moieties in a single platform have become promising candidates. Various nanomaterials, including Au-based nanostructures,9–12 carbon nanomaterials,13–16 copper sulfide hybrids,17–20 iron oxide-based nanoparticles,21–23 polymer nanostructures,24,25 and Prussian blue (PB) nanocomposites26–39 have been extensively explored as promising theranostic nanoagents for ablating cancer. Among these theranostic nanoagents, Prussian blue (PB)-based nanoagents have unique advantages owing to their high bioavailability and safety.26–39 Prussian blue is a typical FDA-approved clinical drug for the safe and effective treatment of radioactive exposure. A high absorbance in the NIR region (650–900 nm) and an excellent conversion capability can be obtained due to the charge transfer transition between Fe(ii) and Fe(iii). During past decades, PB has been explored as an excellent photo-absorbing agent for both photothermal therapy (PTT) and photoacoustic (PA) imaging due to its strong optical absorbance in the NIR region, high photothermal conversion efficiency, and superior photothermal stability.26–39
Photothermal therapy (PTT), as a non-invasive and laser-based methodology to specifically “burn” cancer cells in the presence of photo-absorbing agents, has attracted much attention.40–45 Compared to traditional cancer treatments, PTT is regarded as a less invasive but efficient tumor-therapeutic alternative wherein therapeutic effects only occur when a certain body tissue is exposed to near-infrared (NIR) laser and accumulates the PTT agent, which is a promising method to overcome the therapeutic dilemma of cancer with minimal invasive damage to the surrounding healthy tissue.40–45 For PTT, a very important point is the fabrication of photothermal conversion agents with high biocompatibility, biosafety, and photothermal conversion efficiency. A variety of photothermal conversion agents have been explored, such as various noble metal nanostructures, carbon nanomaterials, copper chalcogenides, and organic compounds.9–25 Though some progresses have been achieved, the intrinsic instability and potential toxicity of these nanomaterials have limited their further clinical translations. PB nanomaterials are considered as good candidates for PTT due to their high biocompatibility and safety.26–39 However, PTT using bare PB nanoparticles (NPs) often suffers from many disadvantages including the lack of protection from degradation and low stability in aqueous media, which limits their further application. Recently, polydopamine (PDA) has been designed to be coated on PB nanomaterials, which gives NPs appropriate bioavailability and stability.46,47 PDA, which is structurally similar to natural melanin, promises a number of bio-applications in drug delivery, diagnosis, and therapy due to its many striking physicochemical properties (adhesive, biocompatible, and biodegradable).46–49 Furthermore, PDA has also been demonstrated to have excellent photothermal activity, which is promising for photothermal therapy. Therefore, coating PDA on the surface of PB may result in a composite material with enhanced photothermal performance and better biocompatibility and stability.
As a new therapeutic method, PTT cannot obtain an ideal therapeutic effect without any imaging techniques in some cases. Imaging-guided photothermal tumor ablation has attracted intensive research interests as one of the most exciting strategies for cancer treatment.50–53 The combination of fluorescence optical imaging and photothermal therapy displays huge advantages. Under the fluorescence optical imaging mode, the parameters of tumors and theranostic nanoagents could be studied before therapy; the treatment procedure could be monitored in real-time during therapy; the effectiveness of the therapy could be assessed after the therapy. As recently developed fluorescent nanoparticles, graphene quantum dots (GQDs) are used in fluorescence optical imaging, exhibiting several advantages over their predecessors, which makes them excellent alternatives for bio-imaging and image-guided therapy: (i) GQDs have unique photoluminescence (PL) with high quantum yield; (ii) GQDs can be easily modified with tumor targeted molecules; (iii) GQDs have excellent solubility and chemical inertness, which are beneficial for facilitating safe and efficient therapy; (iv) GQDs are a cost-effective and environment-friendly preparation, which can hardly be realized with conventional semiconducting quantum dots.50–53
Owing to the above advantages, we have synthesized a versatile PB@PDA@GQDs (PBPGs) nanocomposite as an effective therapeutic agent, which combines PTT and fluorescence optical imaging in this work. The fluorescence properties, photothermal conversion performance, and biocompatibility of PB@PDA@GQDs (PBPGs) were examined. The as-prepared PBPGs showed low cytotoxicity, good fluorescence performance, and excellent photothermal conversion in vitro and in vivo. Importantly, with the combination of PDA, GQDs, and PB, better therapeutic effects on the tumor were achieved. Thus, this work opens up a new access to enhance the photothermal conversion efficiency of nanomaterials as promising multifunctional theranostic nanoplatforms for biomedical applications.
2. Materials and methods
2.1. Chemicals and materials
K3[Fe(CN)6], (NH4)2Fe(SO4)2·6H2O, hyaluronic acid (HA, MW < 8 k), dopamine hydrochloride, carbodiimide (EDC), and N-hydroxysuccinimide (NHS) were purchased from Aladdin Reagent Co., Ltd. Graphene quantum dots (GQDs) was obtained from XFNANO Co., Ltd. (Nanjing, China). Cell counting kit-8 (CCK-8) was purchased from VICMED Biotechnology Co., Ltd. (Xuzhou, China). Dulbecco's Modified Eagle Medium/F12 (DMEM/F12), penicillin–streptomycin, and fetal calf serum (FBS) were purchased from CLARK Bioscience Co., Ltd. (USA). All chemicals are analytically pure and were used as received without further purification. Deionized water was used throughout the experiments.
2.2. Synthesis of PB nanocubes (PBs)
PB nanocubes were synthesized by a method according to the early report.38 Typically, 20 mL of 1.0 mM (NH4)2Fe(SO4)2–HA solution (containing 189 mg HA) was slowly dropped into the as-prepared 1.0 mM K3[Fe(CN)6]–HA solution (20 mL, containing 189 mg HA) under stirring at 90 °C. Also, a blue dispersion was formed immediately and continually stirred for another 6 h. Then, the resulting precipitates were obtained via centrifugation (10 000 rpm, 5 min) and washed with deionized water to obtain HA-modified PB nanocubes (PBs). To facilitate the characterization, a part of the PBs was vacuum-freeze dried and another part was re-dispersed in water.
2.3. Synthesis of PB@PDA nanocomposites (PBPs)
Briefly, PB (1 mg), EDC (0.1 mg), and NHS (0.12 mg) were dissolved in 2 mL deionized water in a plastic centrifuge tube under dark conditions for 12 h. After centrifugation, activated PBs was obtained. Then, dopamine hydrochloride (1.5 mg) was added to the above suspended solution (1 mL deionized water) under oscillating conditions, which was kept overnight. Then, the resulting products were collected by the same method as that for the PBs.
2.4. Preparation of the PB@PDA@GQDs nanocomposites (PBPGs)
0.5 mg PBPs were dispersed in 1 mL deionized water by ultrasonication. Then, 2 mL (1 mg mL−1) GQDs were added to the above solution at 60 °C and oscillated for 6 h. Then, the resulting products were collected by the same method as that for the PBs.
2.5. Characterization
The morphology of all the samples was studied using transmission electron microscopy (FEI Tecnai 12). The composition of the PBPGs was studied on a high-resolution transmission electron microscope (HRTEM, FEI F-30). The UV-vis absorption spectra and fluorescence spectra were acquired on a Shimadzu UV-2550 spectrophotometer in the range of 200–1000 cm−1 (Varian, America) and an FLS980 Series of Fluorescence Spectrometers (Edin, England), respectively. The X-ray photoelectron spectra (XPS) were obtained on an ESCALAB 250Xi system (Thermo Scientific, America). The cell viability was measured by a Mode 680 Microplate Reader (BIO-RAD, USA). The fluorescence images of the cells were acquired on a SP5 confocal laser scanning microscope (CLSM, Leica) upon excitation at 405 nm.
2.6. Photothermal performance
The photothermal effect was studied on an 808 nm NIR laser of Beijing Viasho Technology Co. The temperature of the as-prepared samples was obtained by an infrared thermal camera (Fotric S225). For photothermal effect measurement, the as-prepared samples were exposed to the same NIR irradiation (808 nm, continuous wave, 1 W, 300 s), and the temperature change and the photothermal images were recorded using an infrared thermal camera (Fotric S225). The photothermal conversion efficiency (η) was calculated according to the early literature.38 Also, an aqueous dispersion of PBPGs (0.5 mg mL−1) was irradiated by an 808 nm laser (1 W cm−2) for 3 consecutive laser-on/off cycles to obtain the photothermal stability.
2.7. Cell viability assay and photothermal toxicity in vitro
The cytotoxicity of the as-prepared samples toward mice normal neuroglial cell lines BV2 and the glioma cancer cell C6 was tested according to a standard CCK-8 method. The absorbance of the solution at 450 nm was measured using a microplate reader. Three independent experiments were carried out to obtain the cell viability and photothermal toxicity.
2.8. In vivo infrared thermal imaging
Normal (NS, 100 μL), PBs, PBPs, and PBPGs were injected intravenously into the tumor of the mice. The infrared thermal images and spatial temperature distributions of the tumors were obtained on an infrared thermal camera (Fotric S225) during laser irradiation (808 nm, 1 W cm−2) for 3 min.
2.9. In vivo tumor growth study
Male Balb/c mice (8 weeks) were obtained from Xipuer-BiKai experimental animals Co., Ltd (Shanghai, China). All the animal studies were approved by the Institutional Animal Care and Treatment Committee of the Xuzhou Medical University. C6 cells (1 × 10⁷ cells per mL in PBS) were subcutaneously injected into the right flanks of the Balb/c nude mice to establish the glioma mouse model. Five groups (n = 4 per group) were used in the in vivo photothermal experiments: (i) the control group mice without laser exposure and injection of nanomaterials; (ii) the control group mice with irradiation but no injection nanomaterials; (iii–v) the groups with irradiation and injection of different nanomaterials (iii-PBs, iv-PBPs, v-PBPGs) of 6 mg kg−1. During the treatment, the size of the tumors and the body weights of the mice were monitored every two days for 2 weeks. The volume of the tumors was calculated using (tumor length) × (tumor width)2/2. Finally, the tumors were harvested and collected immediately for H&E and Ki67 staining.
3. Results and discussion
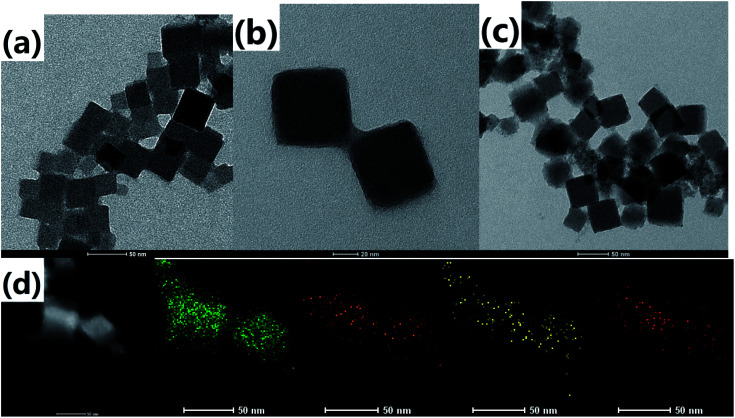
The morphology and size of the as-prepared samples were observed from the transmission electron microscopy (TEM) images. It can be found that the PB nanoparticles have a cubic shape with a size of about 50 nm, as shown in Fig. 1a. There is a vague thin coating layer on the nanoparticle surface due to a small amount of hyaluronic acid on the surface of Prussian blue. After the introduction of dopamine hydrochloride (Fig. 1b), there was an obvious coating layer on the outer of PB, which reflected that PDA was formed successfully on the surface of PB. For PBPGs, it showed uniform distribution of the nanoparticles on the surface of the PDA-coated PB NPs due to the presence of GQDs on its surface in Fig. 1c. The successful preparation of PBPGs was also demonstrated by energy dispersion spectrum (EDS) elemental mapping. It is clear that four elements marked by different colors (iron-green; nitrogen-orange; oxygen-yellow; carbon-red) were found in Fig. 1d. It is obviously that the PBPGs nanocomposites were prepared in our work.
Fig. 1. TEM images of (a) PBs, (b) PBPs, (c) PBPGs, and (d) EDS mapping of PBPGs (green-Fe, orange-N, yellow-O and red-C).
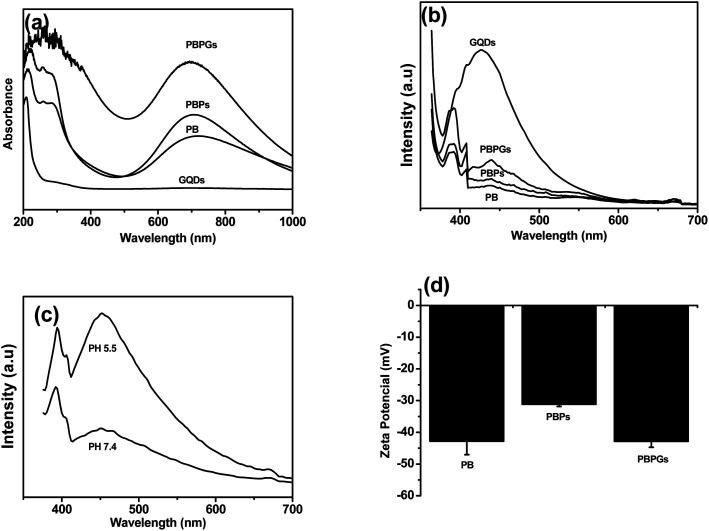
UV-vis and fluorescence spectroscopy were carried out to investigate the formation of these nanocomposites. The representative images and UV-vis spectra of the as-prepared samples (GQDs, PBs, PBPs, and PBPGs) are shown in Fig. S1† and Fig. 2a. Obviously, the color of the sample changed from blue to black when the PBPGs were obtained (Fig. S1†). A broad absorption (550–900 nm) was found in the PB cubes in Fig. 2a due to the charge carrier hopping of Fe2+ and Fe3+. In the spectrum of PBPs, a slight blue-shift was seen compared to that of the pristine PB cubes. However, there is little change in the absorption spectrum of the PBPGs due to the insignificant absorption of GQDs. Fig. 2b represents the fluorescence spectra of all the samples. Before the presence of GQDs, the fluorescence signals for PB and PBPs cannot be found. After the GQDs were introduced, a weak peak at 438 nm in the PBPGs was found in spite of the fluorescence quenching of GQDs on PDA. Considering the properties of PDA, the fluorescence spectra of PBPGs in different pH solutions were also acquired. It can be found that a strong fluorescence emission of PBPGs was found at pH 5.5 in Fig. 2c, which should be derived from the GQDs dissociating on the surface of PDA. Clearly, these results further confirmed the successful preparation of polydopamine and graphene quantum dot-capped Prussian blue nanocubes. Moreover, the zeta potential of the nanocomposites was also measured to monitor and verify the successful formation of the PBPGs. As can be observed in Fig. 2d, there is an obvious change in the zeta potential of PBs, PBPs, and PBPGs, indicating the composition change on the surface of the PBs.
Fig. 2. (a) UV-vis, (b) fluorescence spectra of the prepared samples, (c) fluorescence spectra of PBPGs at different pH, and (d) zeta potential of the prepared samples.
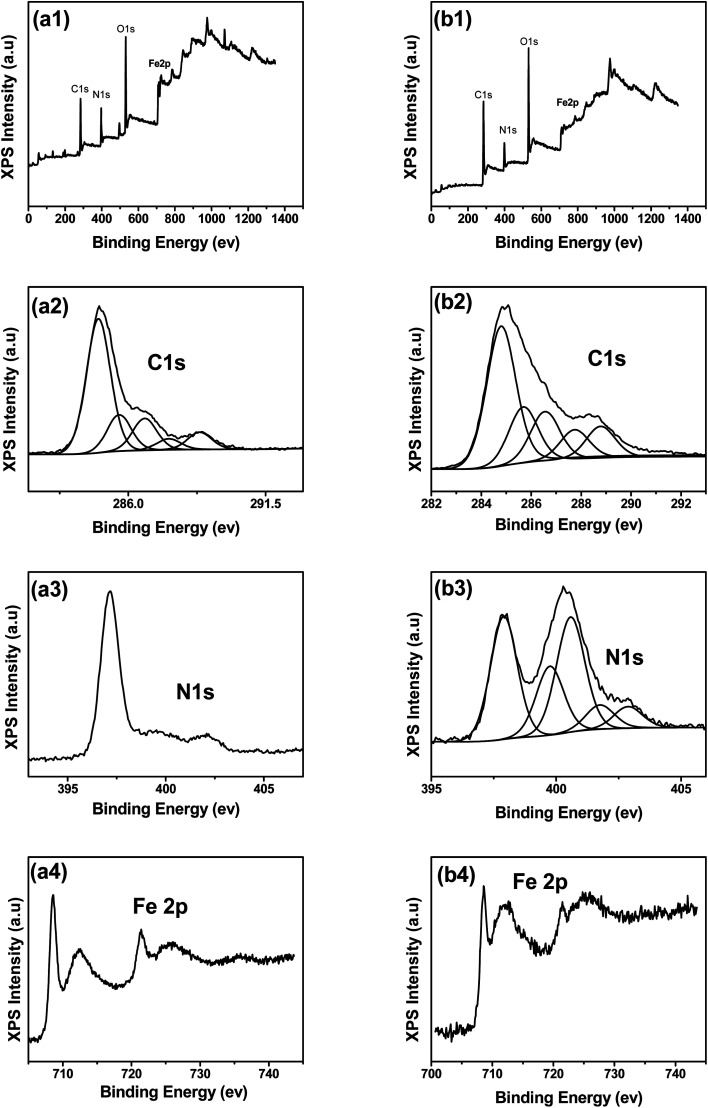
XPS analysis provides detailed information on the chemical composition of the as-prepared nanocomposites. Though the same elements (C, N, O, and Fe elements) exist in the PB and PBPGs in the fully scanned spectra demonstrated (Fig. 3a1 and b1), there is tremendous difference in the detailed electronic states of the elements' higher-resolution spectra. In Fig. 3a2, the C 1s spectrum of PBs displayed the presence of C–C (284.8 eV), C–N (285.6 eV), C–OH (286.6 eV), C O (287.6 eV), and O–C O (288.8 eV) species. By comparison, the proportion of C–N (285.7 eV), C–OH (286.6 eV), and C O (287.7 eV) species was significantly increased in the C 1s spectrum of the PBPGs in Fig. 3b2, which is mainly derived from PDA and GQDs.54–56 Similarly, in contrast to the N 1s signal in PBs (Fig. 3a3), different signals were observed in PBPGs (Fig. 3b3) due to the linkage of PDA and GQDs.54–56 The high-resolution N 1s spectrum of PBPGs (Fig. 3b3) could be deconvoluted into five deconvoluted peaks centered at 397.9 eV, 399.8 eV, 400.6 eV, 401.8 eV, and 402.9 eV, which are assigned to Prussian blue N (–N C), pyridinic N (N doped GQDs), pyrrolic N (PDA), graphitic N (N doped GQDs), and hyaluronic acid N (–N–C), respectively.54–56 The binding energies of Fe 2p3/2 and Fe 2p1/2 were observed at 712.2 and 721.4 eV, respectively, which originated from the presence of Fe3+ in PB (Fig. 3a4 and b4).57 Another peak centered at 708.5 eV can be ascribed to the Fe 2p3/2 of [Fe (CN6)]3−.57 Taken together, the results confirmed the successful synthesis of the PBPGs.
Fig. 3. XPS spectra of PBs (a1–a4) and PBPGs (b1–b4).
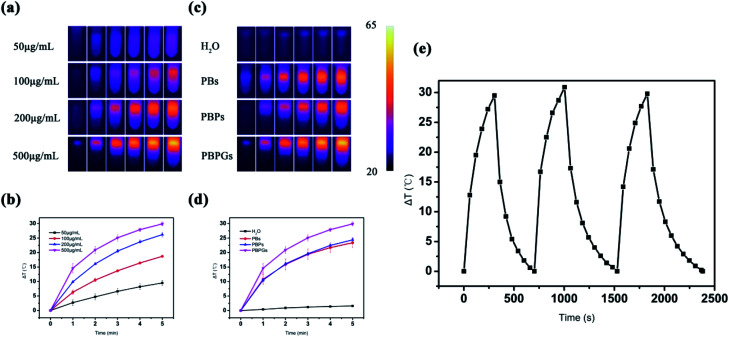
PB-based composites have good photothermal conversion performance, which could be used as photothermal agents to treat cancer under NIR irradiation. The photothermal performances of the as-prepared samples are shown in Fig. 4. The temperature elevation of the aqueous dispersions of PBPGs with different concentrations is given in Fig. 4a and b. As shown in Fig. 4a and b, the temperature increased quickly with the concentration of the PBPGs suspension under NIR laser irradiation. The temperature for 500 μg mL−1 concentration increased to 29.9 °C after 5 min irradiation of the 808 nm laser, which clearly demonstrated that PBPGs had favorable photothermal performance (Fig. 4b). The photothermal performances of PBs, PBPs, and H2O were also studied under the same experimental parameters. Fig. 4c and d exhibited the temperature elevation of aqueous dispersions of PBs, PBPs, and H2O (500 μg mL−1) under the same NIR irradiation (808 nm, continuous wave, 1 W, 5 min). As the control, the temperature of pure water was only increased to 1.6 °C, and those of PBs and PBPs rose to 23.4 °C and 24.4 °C, respectively. Compared with the other samples, the highest temperature rise curves (29.9 °C) indicated that PBPGs had excellent photothermal conversion ability. To investigate the photothermal stability, three cycles of laser on/off irradiation at a power of 1 W cm−2 were also carried out, as shown in Fig. 4e. Comparing the results of the three cycles, no noticeable temperature attenuation is observed, which indicates the good photothermal stability of the PBPGs. The calculated photothermal conversion efficiency (PCE η) is 46.5%, which is higher than that of the PB nanoparticles (36.7%) and carbon dots/PB nanocomposites (∼30%) reported in early literatures29,37 (Fig. S2†).
Fig. 4. (a) IR thermographic images of PBPGs at different concentrations acquired at 0, 1, 2, 3, 4, and 5 min (from left to right). (b) The corresponding photothermal conversion curves. (c) IR thermographic images of different samples with 500 μg mL−1 concentration acquired at 0, 1, 2, 3, 4, and 5 min (from left to right). (d) Photothermal conversion curves of different samples with 500 μg mL−1. (e) Photothermal stability of PBPGs for three consecutive cycles.
For a cancer therapeutic agent, high safety and cytocompatibility in vitro are essential. To show the high safety and in vitro cytocompatibility of PBPGs, normal neuroglial cell line BV2 and the glioma cancer cell C6 were incubated for 24 h with a concentration range of the as-prepared samples in Fig. S3† and Fig. 5. The as-prepared samples have no toxicity to normal glial cells BV2 in Fig. S3.† For glioma cancer cell C6, over 80% of the C6 cells survived at all the testing concentrations, implying the low cytotoxicity of PBPGs in Fig. 5a. Photothermal therapy, as a minimally invasive therapeutic methodology, is a promising method to eliminate the cancer cells. The anticancer performances of PBPGs in vitro by photothermal therapy methods are discussed in Fig. 5b. It can be seen that there were almost no dead cell for all the groups with the as-prepared samples. However, under laser irradiation, the C6 cell viability of PBPGs was only 8%, which is the lowest in all the testing samples under NIR laser irradiation. This means that 808 nm light activated the PBPGs, which had a lethal effect on the cancer cells.
Fig. 5. (a) The viability of the C6 cells detected by the CCK8 assay after incubating with different nanomaterials with different concentrations. (b) The viability of the C6 cells detected by the CCK8 assay after incubating with different nanomaterials of 200 μg mL−1 concentration under laser irradiation or without laser irradiation.
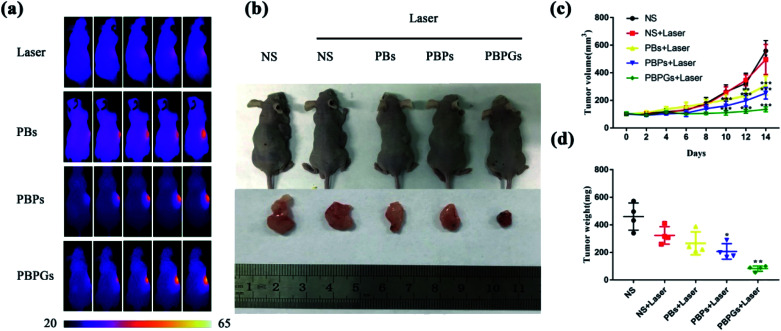
The PTT efficacy of PBPGs was further investigated in vivo, as shown in Fig. 6. Fig. 6a provides the real-time IR thermal photos of the tumor-bearing mice treated with different nanomaterials (NS, PBs, PBPs, and PBPGs) exposed to 808 nm laser (1 W cm−2) for 3 min. It can be seen that the saline-injected tumor (NS) appears pink-red without an obvious change during the irradiation time. There was a little change in the temperature of the irradiated region during 3 min, with a low elevation (2.3 °C). For the PBs- and PBPs-injected tumors, the irradiated tumor region exhibited a medium color change. However, the irradiated tumor in the PBPGs-injected mice showed obvious color change from pink-red to bright yellow, and its temperature goes up rapidly from 37.3 °C to 56.2 °C in 3 min. Clearly, PBPGs has the highest PTT efficacy in vivo. To further investigate the therapeutic effects of the tumor, the mice in these five groups were observed for 14 days and were sacrificed to harvest the tumors at the 14th day. The relative volumes of the tumors in the mice were measured every two days. The photos of the tumor-bearing mice and the curves of the tumor volume and weight (five groups: I (NS), II (NS + laser), and III–V (PBs + laser, PBPs + laser, and PBPGs + laser)) are shown in Fig. 6b–d. It can be found that the relative volume of the tumors from groups I (NS) and II (NS + laser) goes up rapidly in 14 days, respectively (Fig. 6c). However, the relative volumes of tumors in group III–V (PB + laser, PBPS + laser, and PBPGs + laser) obviously goes up slowly in 14 days. In particular, for group V (PBPGs + laser), there is hardly any change in the relative volume of the tumors, suggesting the effective inhibition of tumor growth (Fig. 6c). Simultaneously, the tumor weight in these five groups exhibits a similar trend in Fig. 6d, revealing the high PTT efficacy of the PBPGs.
Fig. 6. (a) IR thermal images of tumor-bearing mice treated with different samples (NS, PBs, PBPs, and PBPGs) under 808 nm laser (1 W cm−2) irradiation. (b) Photos of the tumor-bearing mice and the tumors after two weeks with different injection groups (I (NS), II (NS + laser), and III–V (PB + laser, PBPS + laser, and PBPGs + laser)). (c) The curves of the relative volume of the tumors from different mice with different injection groups (I (NS), II (NS + laser), and III–V (PB + laser, PBPS + laser, and PBPGs + laser)). (d) The curves of the weight of the tumors from different mice with different injection groups (I (NS), II (NS + laser), and III–V (PB + laser, PBPS + laser, and PBPGs + laser)).
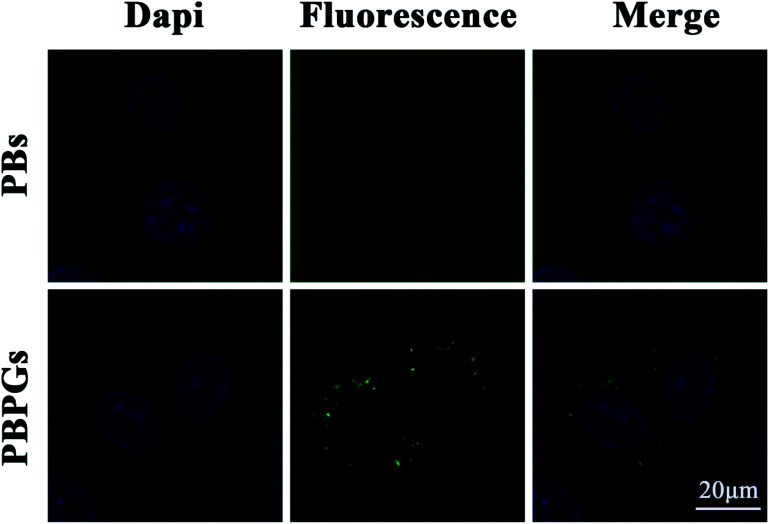
It is well known that bio-imaging can be used to guide the design of the photothermal therapy. PBPGs could be used as optical nanoprobes for bio-imaging at the cellular level due to their unique fluorescence properties and biocompatibility. Fig. 7 shows the confocal laser scanning microscopy (CLSM) images of the C6 cells treated with PBs and PBPGs. It can be found that no any fluorescence emission was seen in the cytoplasm of the C6 cells incubated with PBs. However, obvious green fluorescence emission was seen in the cytoplasm of the C6 cells incubated with PBPGs under 405 nm laser excitation, which indicated that PBPGs could be efficiently taken up by the C6 cells. However, almost no fluorescence emission was seen in the cytoplasm of normal glial BV2 cells incubated with PBPGs under the same experimental condition in Fig. S4.† It was found that PBPGs possessed great promise in serving as effective optical nanoprobes in tumor diagnosis and treatment due to the acidic microenvironment in the tumor.
Fig. 7. CLSM images of C6 cells incubation with PBs and PBPGs (blue refer to nucleus; green refers to fluorescence emission).
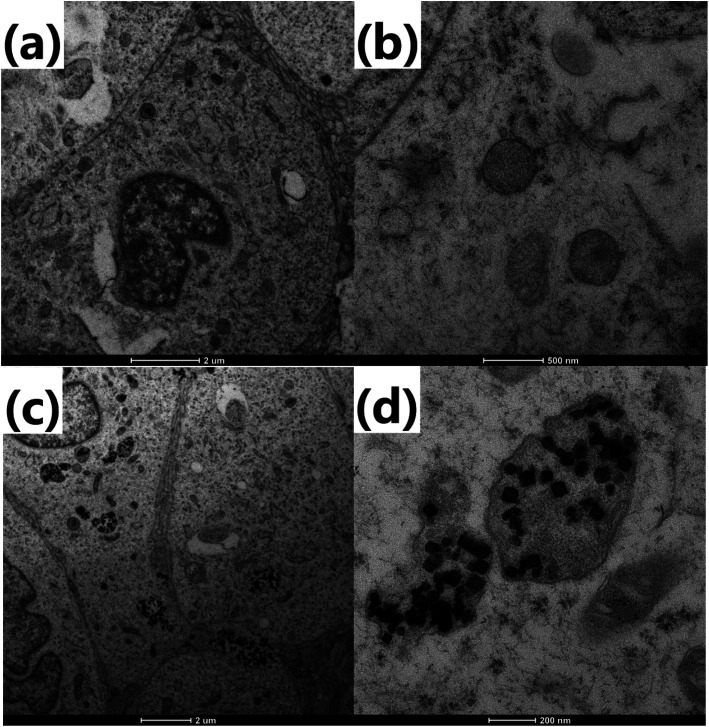
The uptake of PBPGs by C6 cells was further confirmed by TEM. As shown in Fig. 8a, there are no nanoparticles in C6 cells without the introduction of PBPGs. However, when C6 was incubated with PBPGs, many PBPGs were found in the cytoplasm of the C6 cells, which further demonstrated that PBPGs could be efficiently taken up by the C6 cells.
Fig. 8. TEM images of (a and b) C6 cells and (c and d) C6 cells incubated with PBPGs for 12 h.
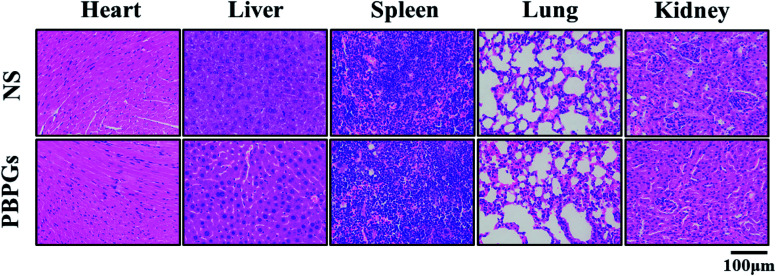
The potential toxicity of PBPGs in vivo was also investigated using the H&E staining test, as shown in Fig. 9. The major organs including the heart, liver, spleen, lungs, and kidneys were collected and stained with H&E. Compared to the control groups, no notable toxicity was observed in the tissues from the animals of the PBPGs groups. All these results suggested that PBPGs have negligible toxicity in vivo, which is crucial for in vivo biomedical applications.
Fig. 9. H&E staining of the major organs of mice injected with NS and PBPGs.
To clarify the role of PBPGs with laser irradiation in proliferation inhibition, Ki67 staining was used as a marker to assess the proliferative fraction in tumors. The results in group V (PBPGs + laser) showed much slighter Ki67 staining than that of mice in the normal NS group (group I) (Fig. 10a and b). This finding collectively revealed that PBPGs with laser irradiation inhibit the growth of cancer in vivo.
Fig. 10. (a) Ki-67 expression in the tumor of group I (NS) and group V (PBPGs + laser). (b) The relative intensity of Ki67 of group I (NS) and group V (PBPGs + laser). Representative images are provided as indicated; scale bar, 100 μm. Data are mean ± SD from three independent experiments. Unpaired t test; ***p < 0.001.
4. Conclusion
In summary, polydopamine and graphene quantum dot-capped Prussian blue nanocubes were successfully prepared by a simple chemical synthesis method. Various spectroscopic and microscopic techniques were used to characterize this nanocomposite. The as-prepared PBPGs nanocomposite not only had good bio-imaging property and high photothermal conversion efficiency but could also efficiently illuminate C6 tumor cells due to its unique fluorescence properties and could realize excellent photothermal therapeutic effect for tumor-bearing mice employing photothermal therapy. Therefore, PBPGs can act as a biocompatible multifunctional bio-imaging and photothermal nanoagent. In the present findings, the PBPGs nanocomposite has the potential for bio-imaging and tumor photothermal therapy, facilitating bioimaging-guided cancer photothermal therapy in a single system.
Conflicts of interest
There are no conflicts to declare.
Supplementary Material
Acknowledgments
This work is funded by the National Natural Science Foundation of China (No. 21505118), Postdoctoral Research Funding Program of Jiangsu Province of China (1701133C) and Postgraduate Research & Practice Innovation Program of Jiangsu Province (KYCX20_2080).
Electronic supplementary information (ESI) available. See DOI: 10.1039/d0ra10491d
Notes and references
- Thun M. J. DeLancey J. O. Center M. M. Jemal A. Ward E. M. Carcinogenesis. 2010;31:100–110. doi: 10.1093/carcin/bgp263. [DOI] [PMC free article] [PubMed] [Google Scholar]
- Komarov P. G. Komarova E. A. Kondratov R. V. Christov-Tselkov K. Coon J. S. Chernov M. V. Gudkov A. V. Science. 1999;285:1733–1737. doi: 10.1126/science.285.5434.1733. [DOI] [PubMed] [Google Scholar]
- Zhang T.-T. Xu C.-H. Zhao W. Gu Y. Li X.-L. Xu J.-J. Chen H.-Y. Chem. Sci. 2018;9:6749–6757. doi: 10.1039/C8SC02446D. [DOI] [PMC free article] [PubMed] [Google Scholar]
- Dehvari K. Lin P.-T. Chang J.-Y. J. Mater. Chem. B. 2018;6:4676–4686. doi: 10.1039/C8TB00734A. [DOI] [PubMed] [Google Scholar]
- Wang H. M. An L. Tao C. Ling Z. Y. Lin J. M. Tian Q. W. Yang S. P. Nanoscale. 2020;12:5139–5150. doi: 10.1039/C9NR10039C. [DOI] [PubMed] [Google Scholar]
- Zhu H. J. Cheng P. H. Chen P. Pu K. Y. Biomater. Sci. 2018;6:746–765. doi: 10.1039/C7BM01210A. [DOI] [PubMed] [Google Scholar]
- Tian X. W. Li Z. Ding N. Zhang J. H. Chem. Commun. 2020;56:3629–3632. doi: 10.1039/D0CC00416B. [DOI] [PubMed] [Google Scholar]
- Wu X. L. Yang H. Yang W. T. Chen X. M. Gao J. X. Gong X. Q. Wang H. J. Duan Y. Wei D. H. Chang J. J. Mater. Chem. B. 2019;7:4734–4750. doi: 10.1039/C9TB00860H. [DOI] [PubMed] [Google Scholar]
- Qin Z. P. Bischof J. C. Chem. Soc. Rev. 2012;41:1191–1217. doi: 10.1039/C1CS15184C. [DOI] [PubMed] [Google Scholar]
- Du Z. Yan K. L. Cao Y. Li Y. Yao Y. Q. Yang G. Mater. Sci. Eng., C. 2020;117:111340. doi: 10.1016/j.msec.2020.111340. [DOI] [PubMed] [Google Scholar]
- Zhu J. F. Wang Y. Huo D. Ding Q. Q. Lu Z. D. Hu Y. Mater. Sci. Eng., C. 2019;105:110023. doi: 10.1016/j.msec.2019.110023. [DOI] [PubMed] [Google Scholar]
- Bhana S. O'Connor R. Johnson J. Ziebarth J. D. Henderson L. Huang X. H. J. Colloid Interface Sci. 2016;469:8–16. doi: 10.1016/j.jcis.2016.02.012. [DOI] [PubMed] [Google Scholar]
- Xu Q. Li W. J. Ding L. Yang W. J. Xiao H. H. Ong W. J. Nanoscale. 2019;11:1475–1504. doi: 10.1039/C8NR08738E. [DOI] [PubMed] [Google Scholar]
- Robinson J. T. Tabakman S. M. Liang Y. Y. Wang H. L. Casalongue H. S. Vinh D. Dai H. J. J. Am. Chem. Soc. 2011;133:6825–6831. doi: 10.1021/ja2010175. [DOI] [PubMed] [Google Scholar]
- Patel K. D. Singh R. K. Kim H. W. Mater. Horiz. 2019;6:434–469. doi: 10.1039/C8MH00966J. [DOI] [Google Scholar]
- Chen D. Q. Dougherty C. A. Zhu K. C. Hong H. J. Controlled Release. 2015;210:230–245. doi: 10.1016/j.jconrel.2015.04.021. [DOI] [PubMed] [Google Scholar]
- Liu K. Liu K. Liu J. C. Ren Q. L. Zhao Z. Wu X. Y. Li D. L. Yuan F. K. Ye K. C. Li B. Nanoscale. 2020;12:2902–2913. doi: 10.1039/C9NR08737K. [DOI] [PubMed] [Google Scholar]
- Yu W. J. Yu N. Wang Z. J. Li X. Song C. Jiang R. Q. Geng P. Li M. Q. Yin S. W. Chen Z. G. J. Colloid Interface Sci. 2019;555:480–488. doi: 10.1016/j.jcis.2019.08.001. [DOI] [PubMed] [Google Scholar]
- Zhang L. Li Y. C. Jin Z. X. Chan K. M. Yu J. C. RSC Adv. 2015;5:93226–93233. doi: 10.1039/C5RA19458J. [DOI] [Google Scholar]
- Wang L. RSC Adv. 2016;6:82596–82615. doi: 10.1039/C6RA18355G. [DOI] [Google Scholar]
- Han Q. H. Wang X. D. Sun Z. Q. Xu X. F. Jin L. H. Qiao L. X. Yuan Q. H. J. Mater. Chem. B. 2018;6:5443–5450. doi: 10.1039/C8TB01184B. [DOI] [PubMed] [Google Scholar]
- Zhong D. N. Zhao J. Li Y. Y. Qiao Y. Wei Q. L. He J. Xie T. T. Li W. L. Zhou M. Biomaterials. 2019:219. doi: 10.1016/j.biomaterials.2019.119369. [DOI] [PubMed] [Google Scholar]
- Gao Z. F. Liu X. J. Wang Y. Y. Deng G. Y. Zhou F. Wang Q. Zhang L. J. Lu J. Dalton Trans. 2016;45:19519–19528. doi: 10.1039/C6DT03897B. [DOI] [PubMed] [Google Scholar]
- Bi X. X. Su H. L. Shi W. Liu X. He Z. Zhang X. M. Sun Y. A. Ge D. T. J. Mater. Chem. B. 2018;6:7877–7888. doi: 10.1039/C8TB01921E. [DOI] [PubMed] [Google Scholar]
- Song X. J. Chen Q. Liu Z. Nano Res. 2015;8:340–354. doi: 10.1007/s12274-014-0620-y. [DOI] [Google Scholar]
- Wu M. Wang Q. T. Liu X. L. Liu J. F. RSC Adv. 2015;5:30970–30980. doi: 10.1039/C4RA16138F. [DOI] [Google Scholar]
- Gautam M. Poudel K. Yong C. S. Kim J. O. Int. J. Pharm. 2018;549:31–49. doi: 10.1016/j.ijpharm.2018.07.055. [DOI] [PubMed] [Google Scholar]
- Ali L. M. A. Mathlouthi E. Kajdan M. Daurat M. Long J. Sidi-Boulenouar R. Cardoso M. Goze-Bac C. Amdouni N. Guari Y. Larionova J. Gary-Bobo M. Photodiagn. Photodyn. Ther. 2018;22:65–69. doi: 10.1016/j.pdpdt.2018.02.015. [DOI] [PubMed] [Google Scholar]
- Chen H. J. Ma Y. Wang X. W. Wu X. Y. Zha Z. B. RSC Adv. 2017;7:248–255. doi: 10.1039/C6RA24979E. [DOI] [Google Scholar]
- Moorthy M. S. Hoang G. Subramanian B. Q Bui N. Panchanathan M. Mondal S. Tuong V. P. T. Kima H. Oh J. Prussian blue decorated mesoporous silica hybrid nanocarriers for photoacoustic imaging-guided synergistic chemo-photothermal combination therapy. J. Mater. Chem. B. 2018;6:5220–5233. doi: 10.1039/C8TB01214H. [DOI] [PubMed] [Google Scholar]
- Cheng L. Gong H. Zhu W. W. Liu J. J. Wang X. Y. Liu G. Liu Z. Biomaterials. 2014;35:9844–9852. doi: 10.1016/j.biomaterials.2014.09.004. [DOI] [PubMed] [Google Scholar]
- Jing L. J. Shao S. M. Wang Y. Yang Y. B. Yue X. L. Dai Z. F. Theranostics. 2016;6:40–53. doi: 10.7150/thno.13250. [DOI] [PMC free article] [PubMed] [Google Scholar]
- Sahu A. Lee J. H. Lee H. G. Jeong Y. Y. Tae G. J. Controlled Release. 2016;236:90–99. doi: 10.1016/j.jconrel.2016.06.031. [DOI] [PubMed] [Google Scholar]
- Yang Z. L. Tian W. Wang Q. Zhao Y. Zhang Y. L. Tian Y. Tang Y. X. Wang S. J. Liu Y. Ni Q. Q. Lu G. M. Teng Z. G. Zhang L. J. Adv Sci. 2018;5:1700847. doi: 10.1002/advs.201700847. [DOI] [PMC free article] [PubMed] [Google Scholar]
- Jia X. Q. Cai X. J. Chen Y. Wang S. G. Xu H. X. Zhang K. Ma M. Wu H. X. Shi J. L. Chen H. R. ACS Appl. Mater. Interfaces. 2015;7:4579–4588. doi: 10.1021/am507443p. [DOI] [PubMed] [Google Scholar]
- Fu G. L. Liu W. Li Y. Y. Jin Y. S. Jiang L. D. Liang X. L. Feng S. S. Dai Z. F. Bioconjugate Chem. 2014;25:1655–1663. doi: 10.1021/bc500279w. [DOI] [PubMed] [Google Scholar]
- Peng X. Wang R. Wang T. J. Yang W. N. Wang H. Gu W. Ye L. ACS Appl. Mater. Interfaces. 2018;10:1084–1092. doi: 10.1021/acsami.7b14972. [DOI] [PubMed] [Google Scholar]
- Zhou B. Jiang B. P. Sun W. Y. Wei F. M. He Y. Liang H. Shen X. C. ACS Appl. Mater. Interfaces. 2018;10:18036–18049. doi: 10.1021/acsami.8b01387. [DOI] [PubMed] [Google Scholar]
- Peng J. R. Yang Q. Li W. T. Tan L. W. Xiao Y. Chen L. J. Hao Y. Qian Z. Y. ACS Appl. Mater. Interfaces. 2017;9:44410–44422. doi: 10.1021/acsami.7b17022. [DOI] [PubMed] [Google Scholar]
- Jaque D. Maestro L. M. del Rosal B. Haro-Gonzalez P. Benayas A. Plaza J. L. Rodriguez E. M. Sole J. G. Nanoscale. 2014;6:9494–9530. doi: 10.1039/C4NR00708E. [DOI] [PubMed] [Google Scholar]
- Farokhi M. Mottaghitalab F. Saeb M. R. Thomas S. J. Controlled Release. 2019;309:203–219. doi: 10.1016/j.jconrel.2019.07.036. [DOI] [PubMed] [Google Scholar]
- Chen J. Q. Ning C. Y. Zhou Z. N. Yu P. Zhu Y. Tan G. X. Mao C. B. Prog. Mater. Sci. 2019;99:1–26. doi: 10.1016/j.pmatsci.2018.07.005. [DOI] [PMC free article] [PubMed] [Google Scholar]
- Zhang Z. J. Wang J. Chen C. H. Adv. Mater. 2013;25:3869–3880. doi: 10.1002/adma.201301890. [DOI] [PubMed] [Google Scholar]
- Shang T. Y. Yu X. Y. Han S. S. Yang B. Biomater. Sci. 2020;8:5241–5259. doi: 10.1039/D0BM01158D. [DOI] [PubMed] [Google Scholar]
- Liu B. Li C. X. Cheng Z. Y. Hou Z. Y. Huang S. S. Lin J. Biomater. Sci. 2016;4:890–909. doi: 10.1039/C6BM00076B. [DOI] [PubMed] [Google Scholar]
- Ambekar R. S. Kandasubramanian B. Biomater. Sci. 2019;7:1776–1793. doi: 10.1039/C8BM01642A. [DOI] [PubMed] [Google Scholar]
- Liu Y. L. Ai K. L. Liu J. H. Deng M. He Y. Y. Lu L. H. Adv. Mater. 2013;25:1353–1359. doi: 10.1002/adma.201204683. [DOI] [PubMed] [Google Scholar]
- Zhong R. Wang R. P. Hou X. M. Song L. Zhang Y. RSC Adv. 2020;10:18016–18024. doi: 10.1039/D0RA02915G. [DOI] [PMC free article] [PubMed] [Google Scholar]
- Batul R. Tamanna T. Khaliq A. Yu A. Biomater. Sci. 2017;5:1204–1229. doi: 10.1039/C7BM00187H. [DOI] [PubMed] [Google Scholar]
- Yoo J. M. Kang J. H. Hong B. H. Chem. Soc. Rev. 2015;44:4835–4852. doi: 10.1039/C5CS00072F. [DOI] [PubMed] [Google Scholar]
- Hai X. Feng J. Chen X. W. Wang J. H. J. Mater. Chem. B. 2018;6:3219–3234. doi: 10.1039/C8TB00428E. [DOI] [PubMed] [Google Scholar]
- Iannazzo D. Ziccarelli I. Pistone A. J. Mater. Chem. B. 2017;5:6471–6489. doi: 10.1039/C7TB00747G. [DOI] [PubMed] [Google Scholar]
- Li Z. Z. Wang D. Xu M. S. Wang J. M. Hu X. L. Anwar S. Tedesco A. C. Morais P. C. Bi H. J. Mater. Chem. B. 2020;8:2598–2606. doi: 10.1039/C9TB02529D. [DOI] [PubMed] [Google Scholar]
- Rella S. Mazzotta E. Caroli A. Luca M. D. Bucci C. Malitesta C. Appl. Surf. Sci. 2018;447:31–39. doi: 10.1016/j.apsusc.2018.03.057. [DOI] [Google Scholar]
- Solati N. Mobassem S. Kahraman A. Ogasawara H. Kaya S. Appl. Surf. Sci. 2019;495:143518. doi: 10.1016/j.apsusc.2019.07.260. [DOI] [Google Scholar]
- Lu S. K. Liao F. Wang T. Zhu L. L. Shao M. W. J. Lumin. 2016;175:88–93. doi: 10.1016/j.jlumin.2016.02.024. [DOI] [Google Scholar]
- Zhang Y. Y. Xiao R. Y. Wang S. F. Zhu H. X. Song H. N. Chen G. N. Lin H. F. Zhang J. Xiong J. H. J. Hazard. Mater. 2020;398:122863. doi: 10.1016/j.jhazmat.2020.122863. [DOI] [PubMed] [Google Scholar]
Associated Data
This section collects any data citations, data availability statements, or supplementary materials included in this article.


