. 2021 Feb 25;11(15):8694–8700. doi: 10.1039/d1ra01103k

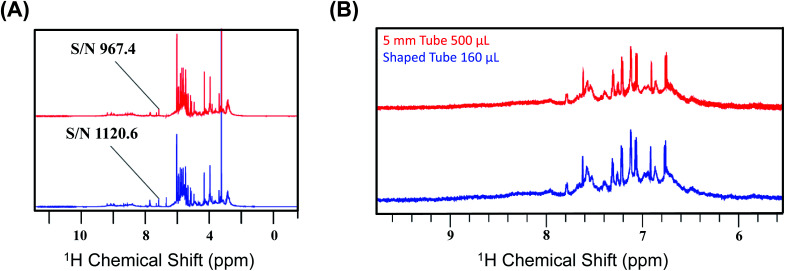
Fig. 2. (A) Representation of the 1D NMR proton spectra of bovine serum albumin at CTO with a 5 mm tube (red) and at SNTO with a shaped tube (blue). The peak at 5.25 ppm is highlighted as the signal to noise ratio (SNR), calculated for both the cases using this peak. The noise region was kept at 11–12 ppm during the calculation of SNR. (B) Representation of the two 1D NMR proton spectra of media used for culturing human embryos in in vitro fertilization (IVF) recorded on 800 MHz spectrometers (Bruker Avance) with a cryoprobe. The top profile represents the spectra which was recorded at CTO with a 5 mm tube (red), and the bottom spectra were recorded at SNTO with a shaped tube (blue). The peaks that are considered for the SNR calculation are given in Table S3b..

Fig. 2