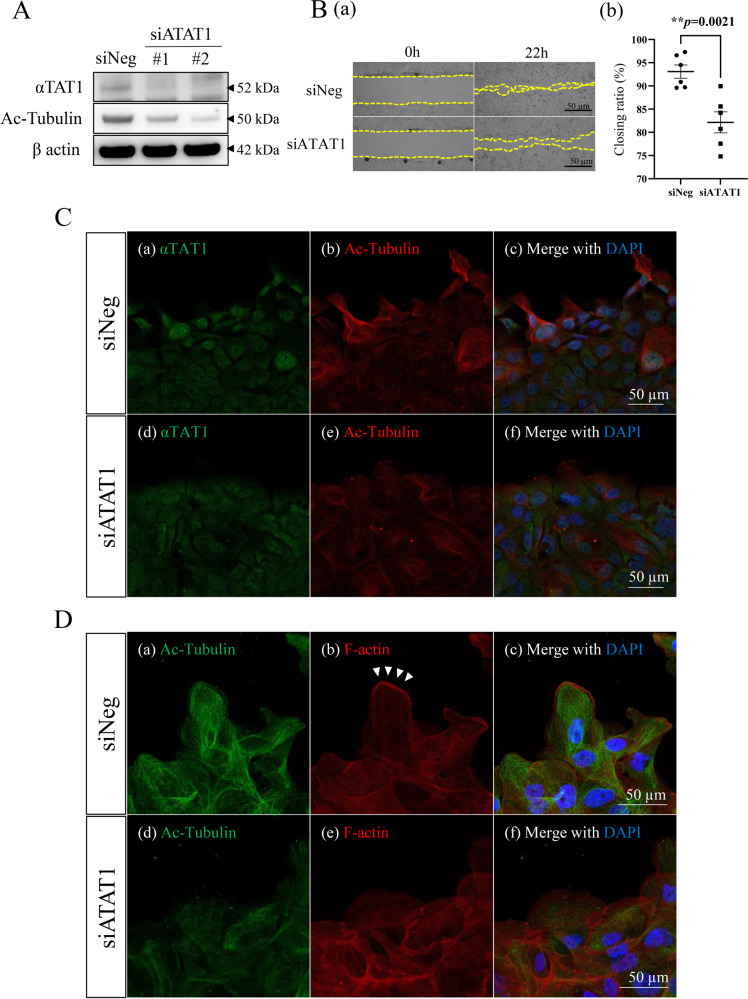
Fig. 2. Analyses of αTAT1-induced tubulin acetylation on the cell migration in AM-1 cells.
A Western blots of αTAT1 and Acetylated α-tubulin (Ac-Tubulin) in control (scramble siRNA transfected; siNeg) and αTAT1 knocked down cells (siATAT1). B (a) Wound healing assay to evaluate the migration ability of AM-1 cells in the control (siNeg) and siATAT1 transfected conditions. The front line of migrative AM-1 cells is represented by a yellow dotted line in each panel. The culture is stopped after 22 h. Scale bars: 50 μm. b Each dot in the graph indicates the closing ratio of the wounded area in siNeg or siATAT1 transfected condition. Statistical significance was set as **p < 0.01 (n = 6). C Dual immunocytostaining of αTAT1 (green: a, d) and Ac-Tubulin (red: b, e) in the control (siNeg) (a–c) and siATAT1 transfected (d–e) cells. Merged images with DAPI staining are shown in (c, f). Scale bars: 50 μm. D Dual immunocytostaining of Ac-Tubulin (green: a, d) and F-actin (red: b, e) in the control (siNeg) (a–c) and siATAT1 transfected (d–f) cells. Merged images with DAPI staining are shown (c, f). Allow heads show lamellipodium formation at the leading edge of the migrating cells. Scale bars: 50 μm.

