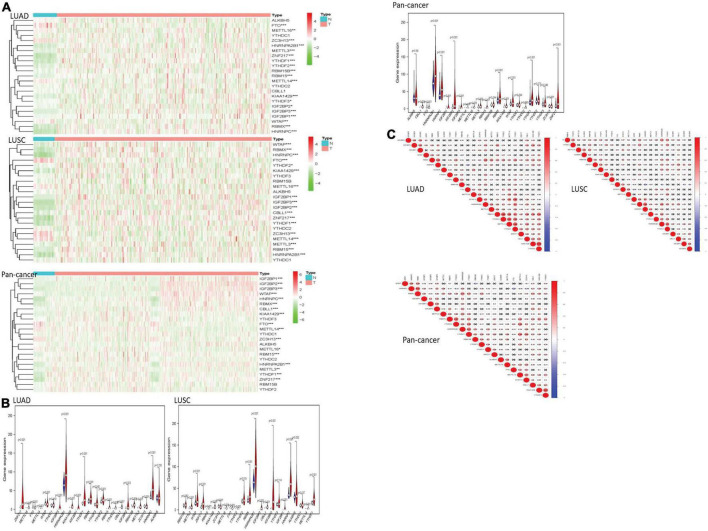
FIGURE 1.
The overview of m6A RNA methylation regulators in lung cancer. (A) The figures reflect the expression levels of 23 m6A RNA methylation regulators in normal tissues and lung cancer tissues. When the gene expression level is high, the color turns red in the picture. However, the color becomes green with the gene expression decreasing. (B) The tree diagram at the top of the figure represents the clustering results of different samples from different experimental groups, and the tree diagram on the left demonstrates the clustering results of different genes from different samples. The “vioplots” clearly show the difference between m6A RNA methylation regulators in lung cancer and normal lung tissue. Blue represents normal lung tissue, and red represents lung cancer. (C) The diagram visually shows the relationship between different m6A RNA methylation regulators through Pearson correlation analysis. Red represents a positive correlation, and blue represents a negative correlation. *P < 0.05, **P < 0.01 and ***P < 0.01.

