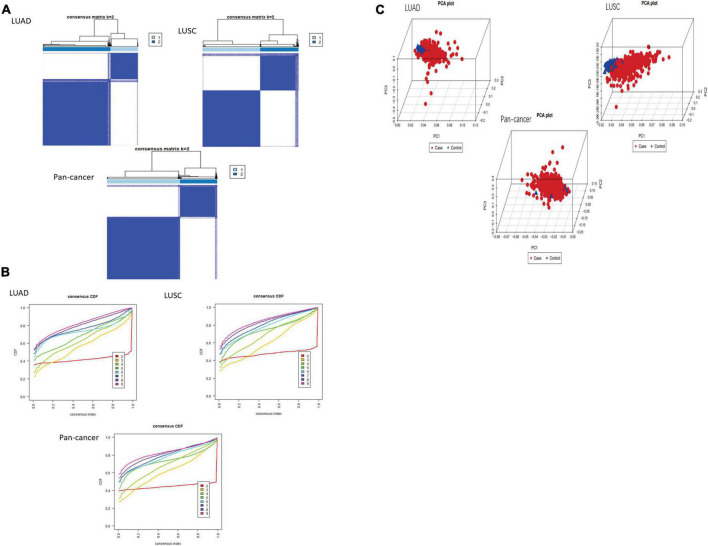
FIGURE 2.
Classification of cluster by m6A RNA methylation regulator. (A,B) As K changed from 2 to 9, clustering cumulative distribution function of different lung cancer groups has been shown discriminatively. The consistent clustering matrix is the most suitable when K = 2. (C) PCR analysis results of the principal components are shown in the RNA expression profile among the TCGA database. Red represents lung cancer cases in cluster 1. Blue represents normal lung tissue of cluster 2.

