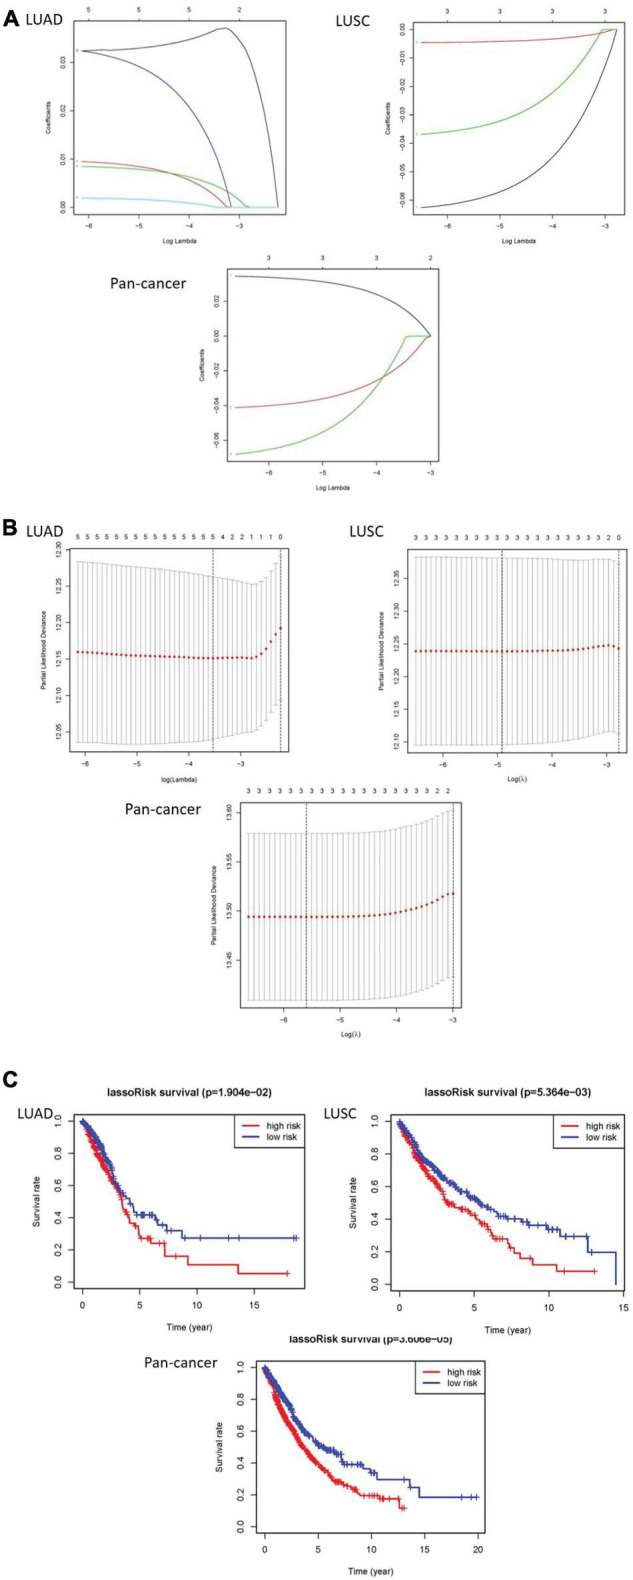
FIGURE 4.

The results of LASSO Cox regression algorithm and survival curves. (A,B) Show coefficient results derived from LASSO Cox regression algorithm. (C) There are distinct differences of overall survival curves in the high-risk group and low-risk group which are distributed by risk score.
