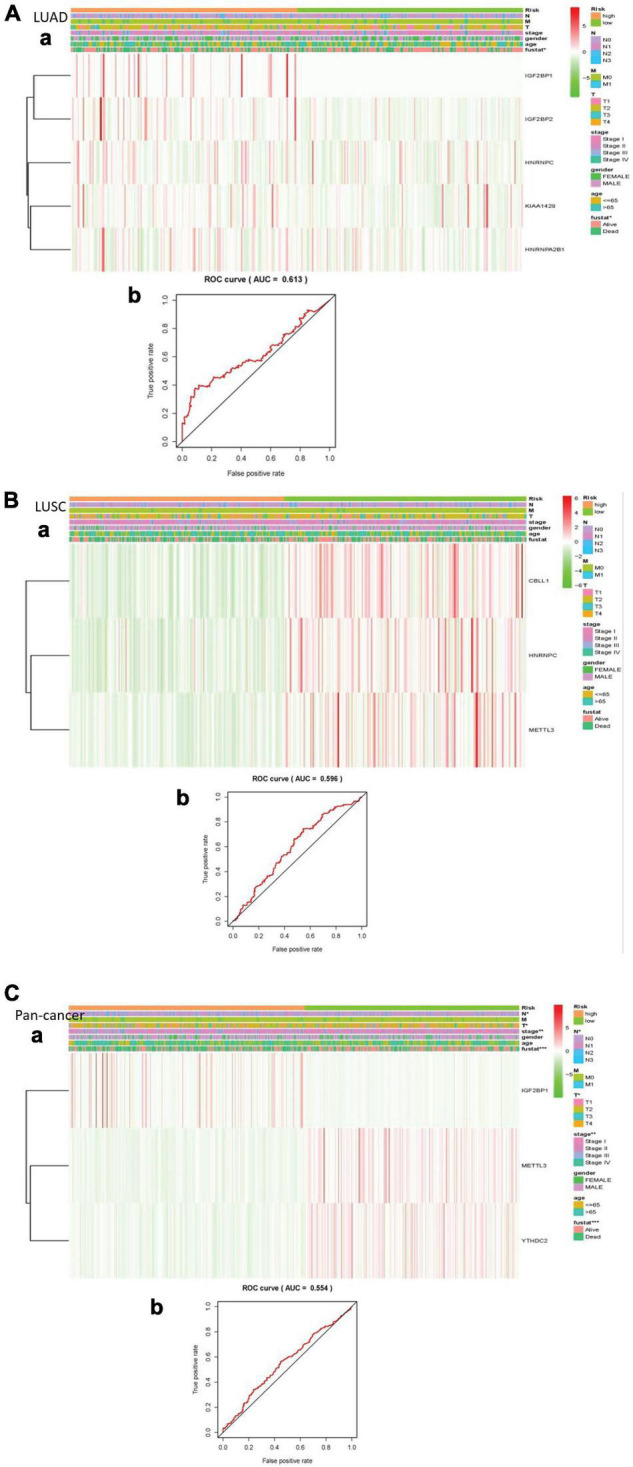
FIGURE 5.

Explain the relationship between risk score, m6A RNA methylation regulator expression level, clinical pathological characteristics, risk group, and overall survival rate. (A) LUAD; (B) LUSC; (C) pan-cancer. (a) Every ROC curve indicates the relationship between risk score and survival rate, reflecting the predictive efficiency of prognostic signatures. (b) Each heatmap shows the expression level of m6A RNA methylation regulator in lung cancer of two clusters. In addition, there are apparent differences in the distribution of clinical pathological characteristics between the two groups. When P < 0.001, the result is significant.
