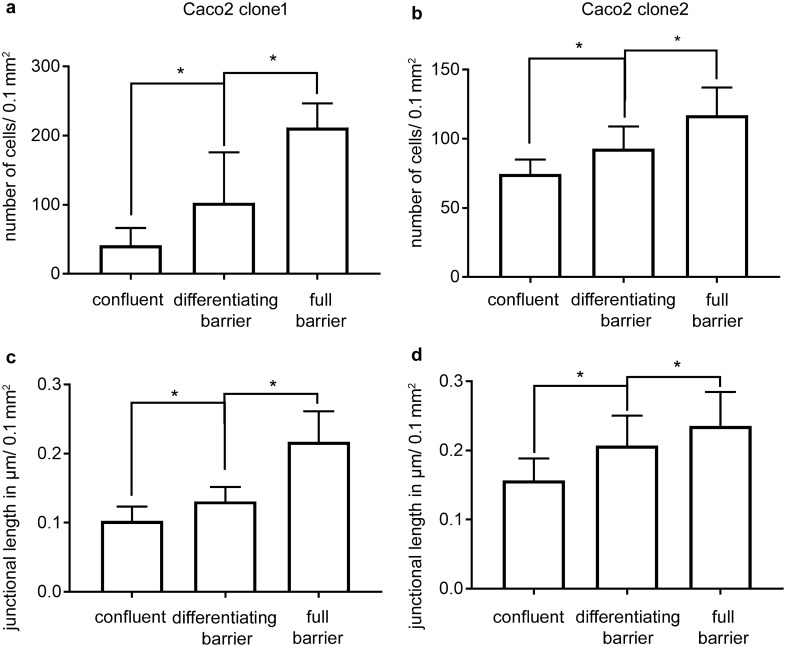
Fig. 2.
Changes in cell numbers and junctional length during differentiation. a The changes in the number of cells during the differentiation of clone 1 are shown. The number of cells/0.1 mm2 steadily increased until day 14, where a maximum of 211 ± 3 per 0.1 mm2 was reached (n = 8, *p < 0.05, one-way ANOVA). bLikewise, the average number of cells per 0.1 mm2 of clone 2 rose through the different states of differentiation (n = 8, *p < 0.05, one-way ANOVA). c. The increase in cell number was paralleled by an increase of the junctional length/µm. The junctional length of clone 1 increased from 0.10 ± 0.03 µm/0.1 mm2 to 0.22 ± 0.04 µm/0.1 mm2 at the state of full barrier (n = 8, *p < 0.05, one-way ANOVA). d. Similarly, in clone 2 the junctional length expanded over time (n = 8, *p < 0.05, one-way ANOVA)

