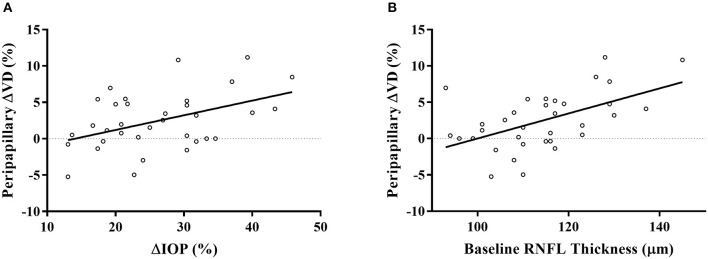
Figure 2.
Scatterplots displayed the significant association of IOP reduction percentage (A) and baseline RNFL thickness (B) with the percentage of peripapillary VD increase after treatment. ΔVD represented the percentage of VD change after a 4-week latanoprost application. ΔIOP represented the percentage of IOP reduction of each subject.

