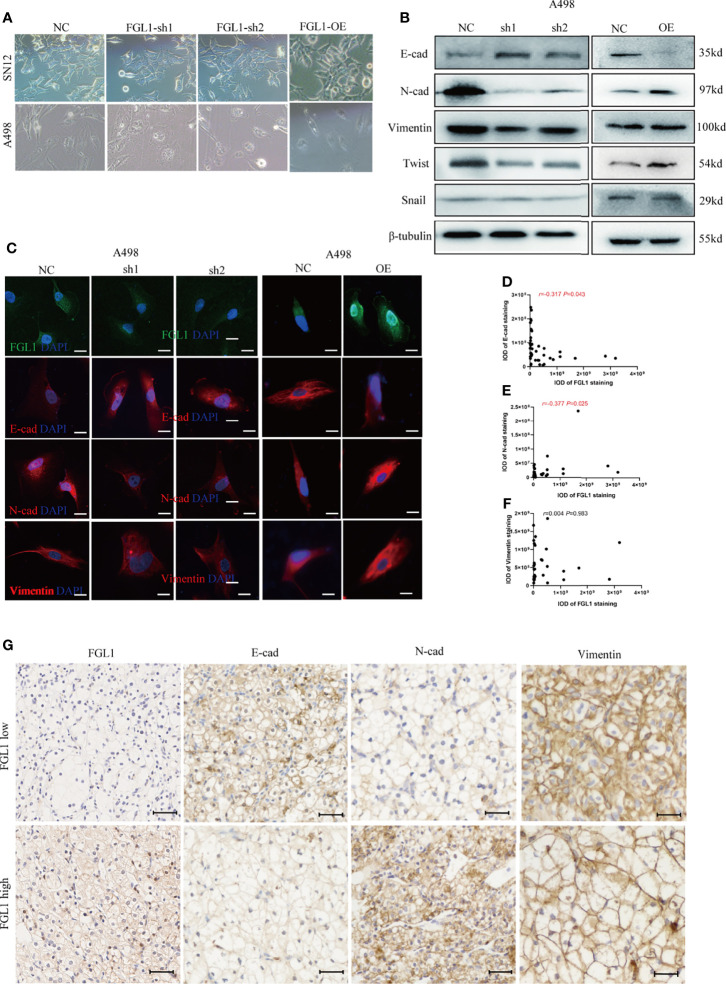
Figure 4.
FGL1 is required for EMT process in ccRCC. (A) cell morphology of A498 and SN12 cells was observed under bright-field microscopy after FGL1 knockdown or overexpression. (B) Western blot analyzed the expression of E-cadherin, N-cadherin, Vimentin, Twist and Snail with FGL1 knockdown or overexpression in A498 cells. (C) Immunofluorescence staining of E-cadherin, N-cadherin, Vimentin after FGL1 knockdown or overexpression in A498 cells, with DAPI nuclear staining in blue, FGL1 in green and EMT markers (E-cadherin, N-cadherin, Vimentin) in red. (D–F) the correlation between FGL1 and E-cadherin (D) N-cadherin (E) and vimentin (F) expression is represented in a scatter plot. Statistical significance was tested by the Pearson correlation test. In the scatter plot, the symbol r represents the Pearson’s correlation coefficient. IOD, integral optical density. (G) Representative images of IHC staining for E-cad, N-cad and Vimentin expression in low- and high-FGL1 tumors. Scale bar, 100μm.

