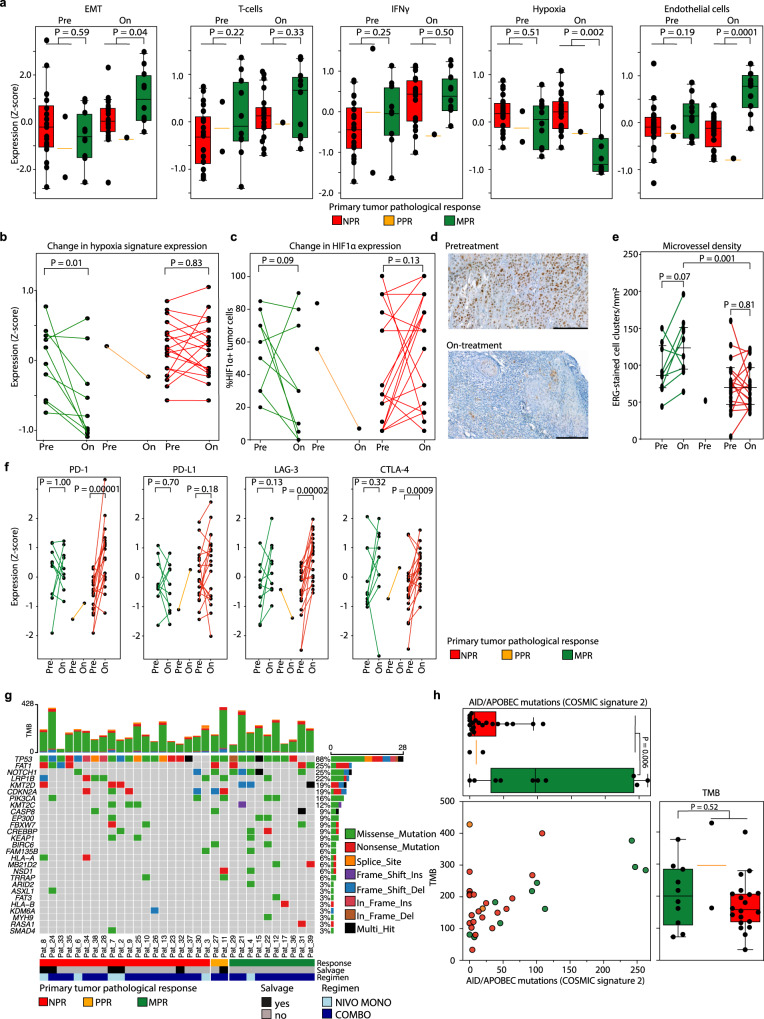
Fig. 2. RNA and whole-exome sequencing.
a Baseline and on-treatment epithelial to mesenchymal transition (EMT)68, T-cell66, IFNγ65, endothelial cell66, and tumor hypoxia33 expression signatures per pathologic response (PR) category assessed by RNA sequencing (RNAseq). Exact P-values were calculated using a two-sided Wilcoxon rank-sum test. Baseline N = all 32 primary tumor samples (10 MPR, 2 PPR, 20 NPR), on-treatment N = 30 primary tumor samples (10 MPR, 1 PPR, 19 NPR). Source data are provided as a Source Data file. b Change in hypoxia gene expression in paired baseline and on-treatment primary tumor samples. An exact P-value was calculated using a two-sided Wilcoxon signed rank test. Baseline N = all 32 primary tumor samples (10 MPR, 2 PPR, 20 NPR), on-treatment N = 30 primary tumor samples (10 MPR, 1 PPR, 19 NPR). Source data are provided as a Source Data file. c Change in the percentage of tumor cells that express hypoxia-inducible factor 1α (HIF-1α) in paired baseline and on-treatment primary tumors, measured by immunohistochemistry. Two MPR patients without analyzable, residual tumor after ICB are included with value ‘0%’. An exact P-value was calculated using a two-sided Wilcoxon signed rank test. Baseline N = all 32 primary tumor samples (10 MPR, 2 PPR, 20 NPR), on-treatment N = 30 primary tumor samples (10 MPR, 1 PPR, 19 NPR). Source data are provided as a Source Data file. d HIF-1α-stained primary tumor slides of a patient with primary tumor MPR at baseline (top) and on-treatment (bottom). Black bars measure 200 μm. e Microvessel density (MVD) in available pre- and on-treatment primary tumor samples. Comparisons between pre- and on-treatment samples of the same patient are made using a two-sided Wilcoxon signed rank test. The comparison between the median MVD of on-treatment MPR and NPR samples is made using a two-sided Wilcoxon rank-sum test. All P-values are exact. Baseline N = 29 (9 MPR, 1 PPR, 19 NPR), on-treatment N = 29 (10 MPR, 0 PPR, 19 NPR). Source data are provided as a Source Data file. f Change in PD-1, PD-L1, LAG-3, and CTLA-4 signature expression in baseline and corresponding on-treatment primary tumor samples per PR category. An exact P-value was calculated using a two-sided Wilcoxon signed rank test. Baseline N = all 32 primary tumor samples (10 MPR, 2 PPR, 20 NPR), on-treatment N = 30 primary tumor samples (10 MPR, 1 PPR, 19 NPR). Source data are provided as a Source Data file. g Oncoplot showing mutations as assessed by whole-exome sequencing (WES) of baseline primary tumor samples. Baseline N = all 32 primary tumor samples (10 MPR, 2 PPR, 20 NPR); a column represents a patient. Top bar chart represents tumor mutational burden (TMB). Percentages listed right represent the proportion of samples harboring a mutation in the gene listed left. Bottom bars show PR, salvage status and ICB regimen. Source data are provided as a Source Data file. h Top plot: number of COSMIC36 signature 2 (AID / APOBEC)-associated mutations per PR category. Right plot: total TMB per ICB response category. The dot plot shows ICB response and the contribution of AID / APOBEC-associated mutations to the TMB per individual sample. Exact P-values were calculated using a two-sided Wilcoxon rank-sum test. Baseline N = all 32 primary tumor samples (10 MPR, 2 PPR, 20 NPR). Source data are provided as a Source Data file. For translational purposes, the three patients that did not undergo surgery were categorized according to their clinical ICB response in this figure: 1 as likely MPR and 2 likely NPR. For a and h, boxplots represent the median and 25th and 75th percentile, the whiskers extend from the hinge to the minimal and maximal data point but no further than 1.5× IQR.

