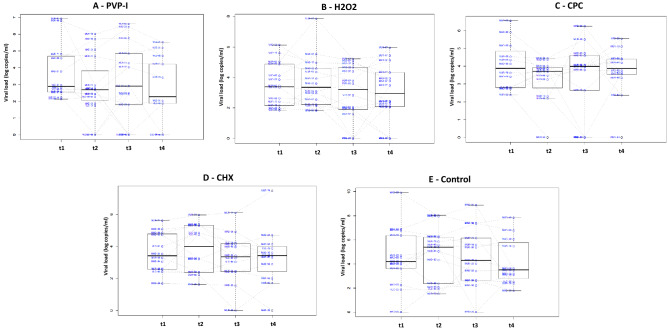
Figure 3.
Salivary viral loads for all five treatment groups through time. Box plots show viral load levels, as measured by qPCR, for each of the patients in the group A—PVP-I (povidone-iodine), B—Hydrogen peroxide (H2O2), C—CPC (cetylpyridinium chloride), D—CHX (chlorhexidine) and E—Distilled water (placebo group) at the four different timepoints (1 for basal and 2, 3 and 4 for the three times after the mouthwash, corresponding to 30, 60 and 120 min after the mouthwash, respectively). Lines joining the samples from the same patient are also shown.

