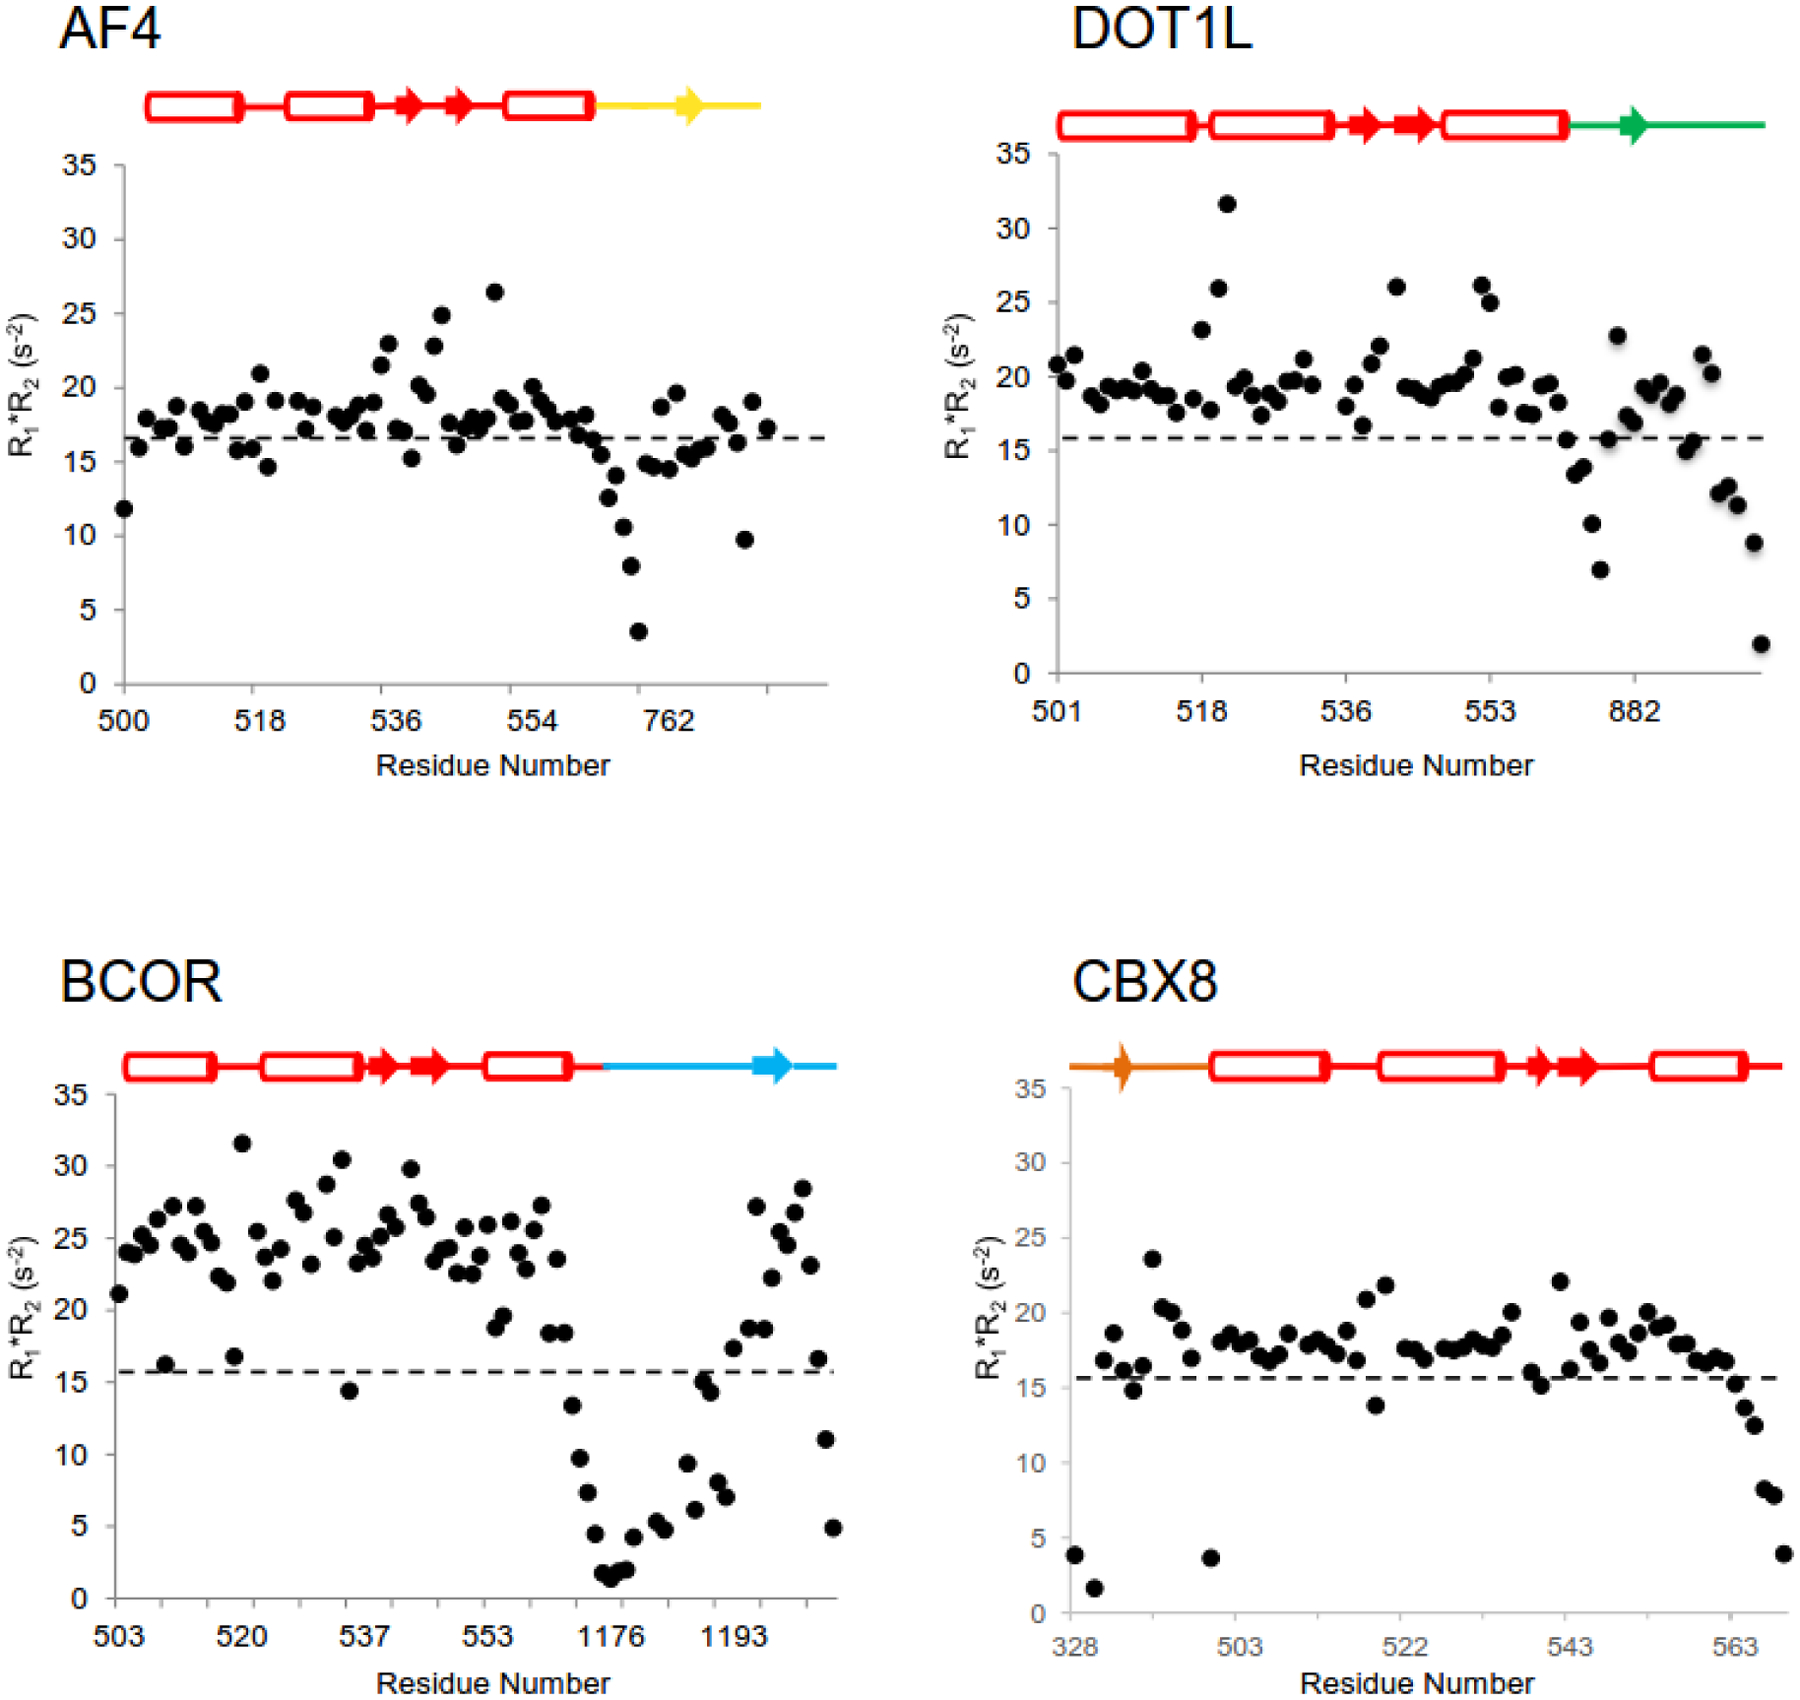
Figure 3. Backbone dynamics of the MLLT3 AHD - AF4, DOT1L, BCOR, CBX8 complexes measured by NMR spectroscopy.

15N R1*R2 values are plotted for each of the four complexes. The schematic above each plot indicates the secondary structure of the AHD as well as the location of data for the AHD and the binding partner in each plot. The dashed line represents the expected value at 14.1 T field strength in the absence of chemical exchange using S2=0.87.
