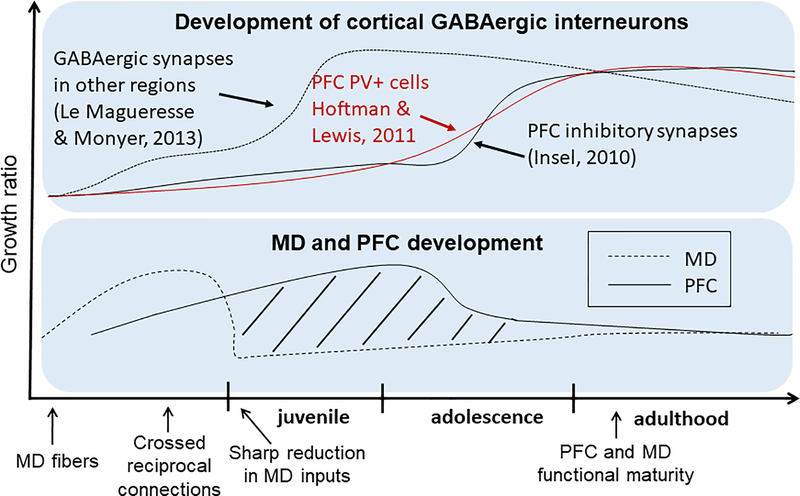
Figure 4.
Developmental trajectory of cortical GABAergic interneurons and maturation of MD and PFC. Upper panel: Distinct developmental trajectories of GABAergic inhibitory synapses and PV+ cells in the PFC (red and black lines) vs other brain regions (dashed line) 75, 250, 251. Lower panel: MD afferent density (dashed line) and volume of the PFC (solid line). Dashed lines represent the different developmental window between MD activity and PFC function. Lower panel is modified from 117, and copyright is permitted for reuse of the figure.

