. 2021 Mar 11;11(18):10512–10523. doi: 10.1039/d0ra10587b

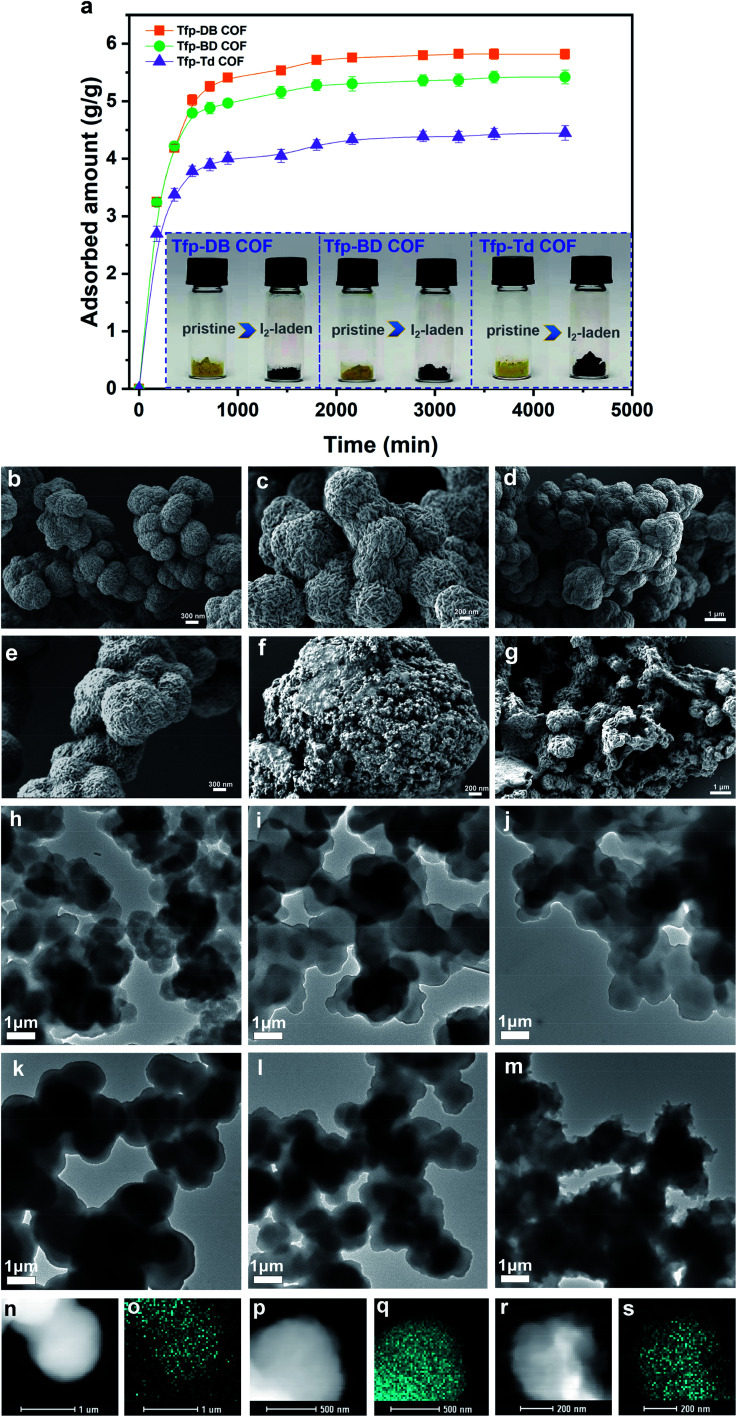
Fig. 3. (a) Adsorption curves of the investigated COFs at 75 °C in saturated iodine vapor (Inset: photographs of the COFs, pristine and after exposure to iodine vapor for 72 h). SEM images of (b) pristine Tfp–DB COF, (c) pristine Tfp–BD COF, (d) pristine Tfp–Td COF, (e) I2-laden Tfp–DB COF, (f) I2-laden Tfp–BD COF, (g) I2-laden Tfp–Td COF. TEM images of (h) pristine Tfp–DB COF, (i) pristine Tfp–BD COF, (j) pristine Tfp–Td COF, (k) I2-laden Tfp–DB COF, (l) I2-laden Tfp–BD COF, (m) I2-laden Tfp–Td COF. (n) STEM of iodine-laden Tfp–DB COF, (o) I-L elemental mapping images of iodine-laden Tfp–DB COF, (p) STEM of iodine-laden Tfp–BD COF, (q) I-L elemental mapping images of iodine-laden Tfp–BD–BD COF, (r) STEM of the iodine-laden Tfp–Td COF, (s) I-L elemental mapping images of the iodine-laden Tfp–Td COF.

Fig. 3