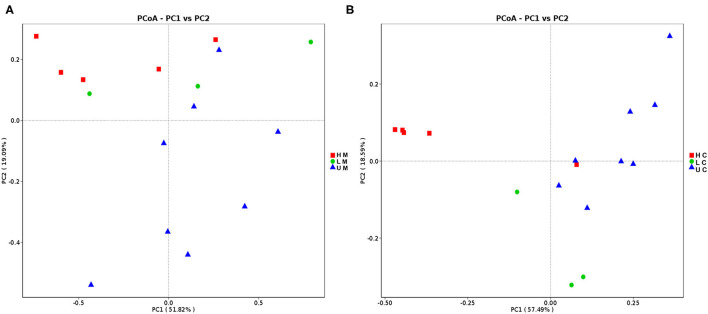
Figure 1.
Principal coordinates analysis (PCoA) of jejunal mucosa (A) and jejunal content (B) microbiome samples from uninfected, low viral load and high viral load groups. HM, jejunal mucosa microbiome samples from the high viral load group; LM, jejunal mucosa microbiome samples from the low viral load group; UM, jejunal mucosa microbiome samples from uninfected group; HC, jejunal content microbiome samples from the high viral load group; LC, jejunal content microbiome samples from the low viral load group; UC, jejunal content microbiome samples from the uninfected group.

