. 2021 Mar 11;11(18):10434–10450. doi: 10.1039/d0ra10221k

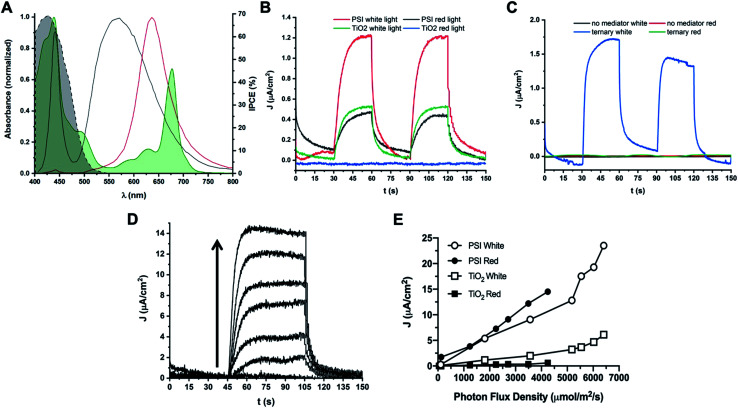
Fig. 11. Photocurrent densities obtained from PSI-sensitized biophotovoltaic devices. Photocurrent densities of PSI-sensitized devices are reported. (A) Spectral irradiance of white and red illumination sources used. White light used for photocurrent experiments is shown in black, red light is shown in red. The UV-Vis absorbance spectrum of PSI is shown overlaid in green and is partially filled in. The dashed black line represents the percent Incident Photon-to-electron Conversion Efficiency (IPCE) of TiO2 semiconductor. (B) Photocurrent densities of cells with Co di-methoxy Cl mediator #5 in fully aqueous electrolyte with and without PSI as sensitizer. Photocurrent densities in both white and red (PSI-specific) light are reported. Light was at 10% capacity of illumination source for all traces (1800 μmol m−2 s−1 for white light, 125 μmol m−2 s−1 for red light). (C) Photocurrent density generation with no mediator present in electrolyte, or the Co di-methoxy PF6 mediator # 2 in the ternary buffer mixture (blue and green) described in previous experiments. (D) Photocurrent density of PSI-Co di-methoxy Cl mediator #5 device as a function of red light intensity measured immediately after device fabrication. Arrow shows direction of increasing light intensity for each trace. Data is quantified in (E). (E) Photocurrent density plotted against PFD of light used for illumination. Data for cells with the aqueous Co di-methoxy Cl mediator #5 and with or without PSI present under both red and white light illumination are shown.

Fig. 11