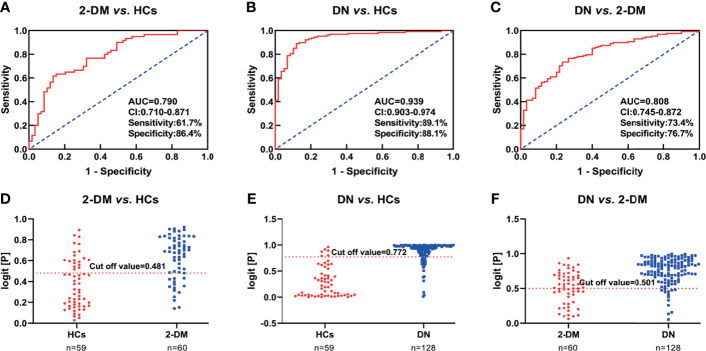
Figure 3.
(A–C) Receiver operating characteristic curve analysis (ROC) in combination with LPE(16:0) and TAG54:2-FA18:1 to discriminate HCs, 2-DM and DN patients in the Validation Set. (D–F) Prediction accuracies of the panel of biomarkers (LPE(16:0) and TAG54:2-FA18:1) in the Validation Set. The area under the curve (AUC) is given at 95 % confidence intervals. AUC, area under the curve; CI, confidence interval.

