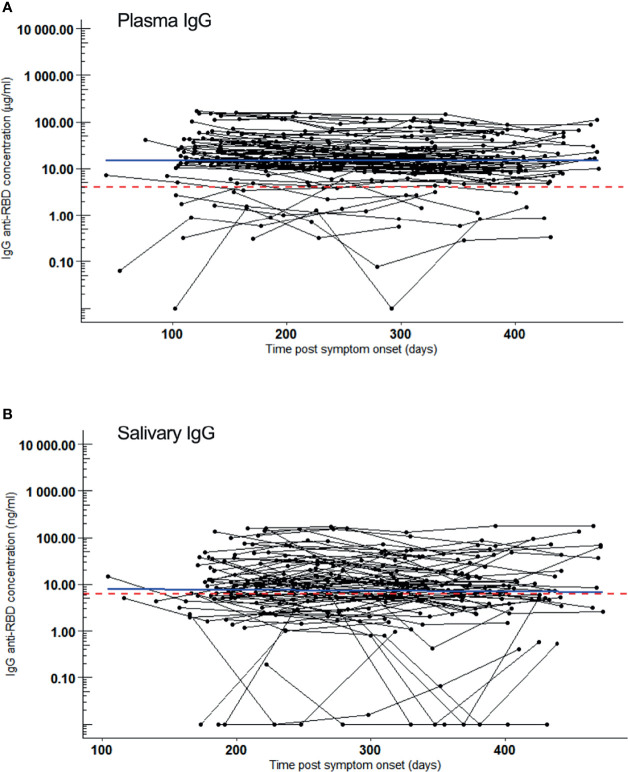
Figure 1.
SARS-CoV-2 RBD reactive IgG over a 15-month follow-up period. Samples were collected 5 times, bimonthly from 72 convalesced volunteers who had mild COVID-19. IgG kinetics are shown per individual (black line). Sampling time points (black dots) are given as days post symptom onset (PSO). Blue line: regression line. Red dotted line: Cut-off for positivity. (A) IgG (µg/ml) kinetics in plasma after COVID-19 convalescence. Slope of linear regression = -0.02, p = 0.2. (B) IgG (ng/ml) kinetics in saliva after COVID-19 convalescence. Slope of linear regression = 0.009, p = 0.7.

