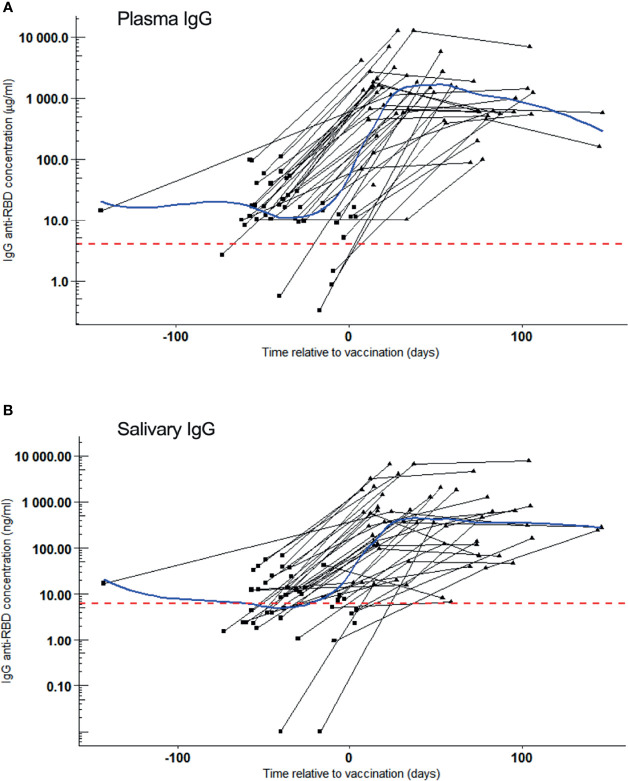
Figure 2.
SARS-CoV-2 RBD reactive IgG after vaccination. Samples were collected of whom 42 became vaccinated during the study. IgG kinetics are shown per individual (black line). Sampling time points (black dots) are given as days post symptom onset (PSO). Blue line: Local Polynomial Regression. Red dotted line: Cut-off for positivity. (A) Plasma IgG (µg/ml) concentration per convalesced volunteer before (square) and after (triangle) one dose of COVID-19 vaccination. Day 0 represents the reported day of vaccination. Local Polynomial Regression, residual standard error: 1979. (B) Salivary IgG (ng/ml) concentration per convalescent volunteer before (square) and after (triangle) one dose of COVID-19 vaccination. Day 0 represents the reported day of vaccination. Local Polynomial Regression, residual standard error: 1354.

