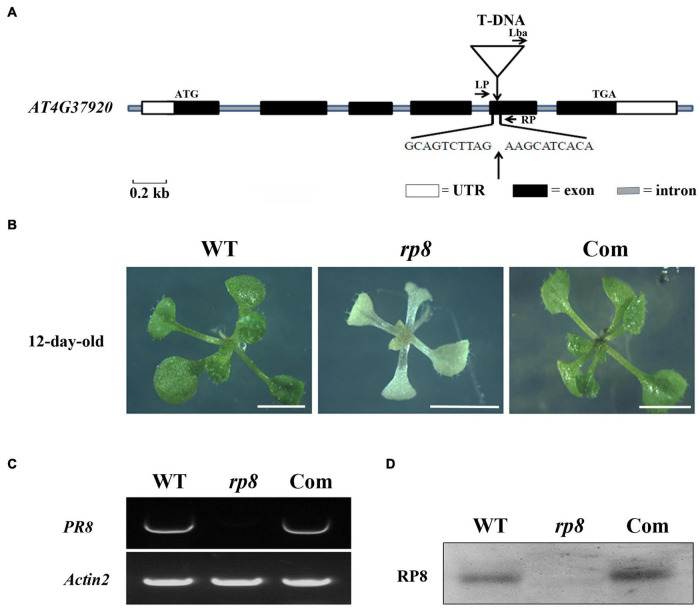
FIGURE 1.
Identification and characterization of the rp8 mutant. (A) Schematic representation of the RP8 gene and the T-DNA insertion. Black boxes represent exons, lines represent introns, and white boxes represent the start and stop regions. The white triangle shows the T-DNA insertion site in the fifth exon of At4g37920. (B) Phenotypes of 12-day-old wild-type (WT), rp8 mutant, and complementation plant (Com). All plants are grown on MS medium containing 2% sucrose under light intensity at 30 μmol m– 2 s– 1. Bars = 0.5 cm. (C) RT-PCR analysis of the RP8 gene expression in WT, rp8 mutant, and complementation plants. Actin2 was used as an internal control. (D) Immunoblot analysis of the RP8 protein in WT, rp8 mutant, and complementation plants. Each lane was loaded with 30 μg total proteins.

