
Figure 11.
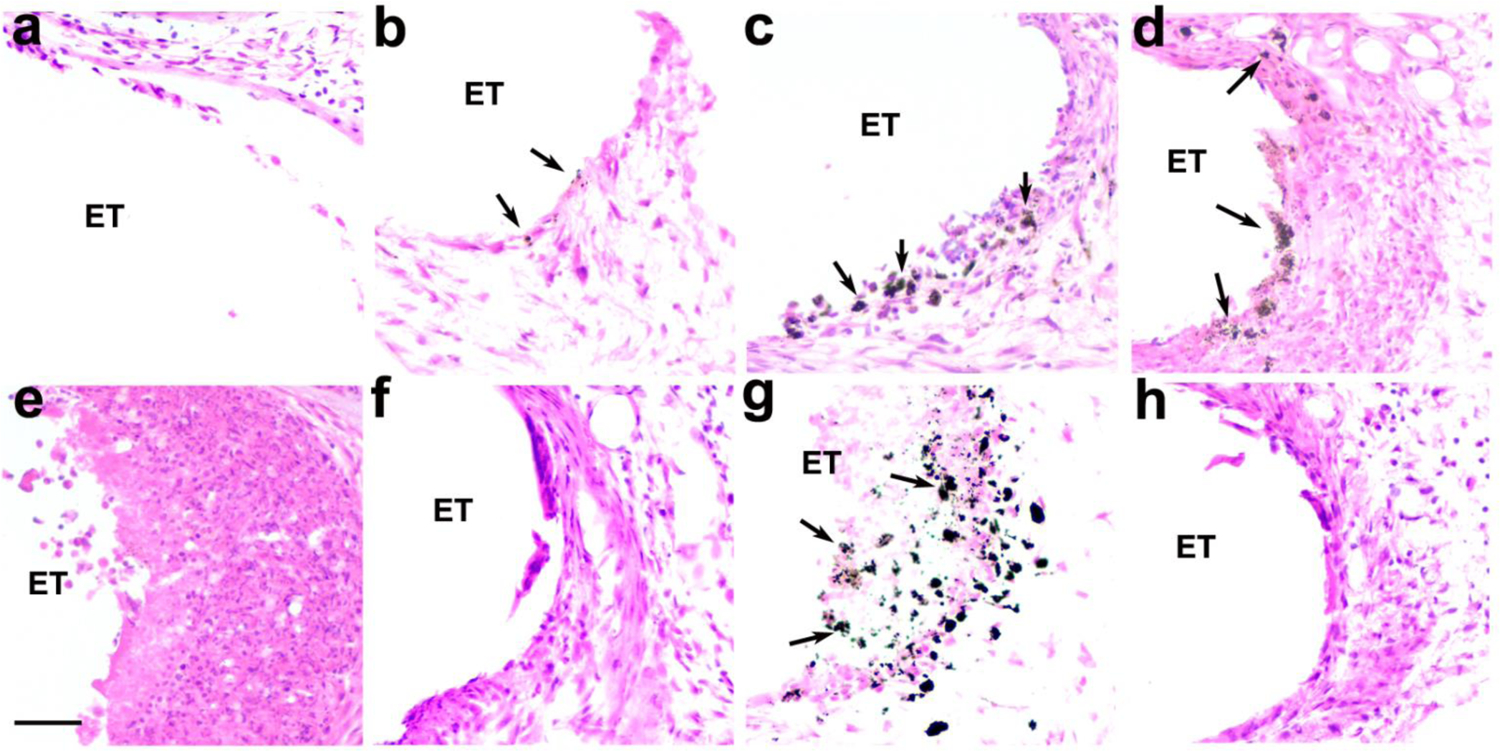
Representative photomicrographs illustrating the electrode-tissue capsule (ET) in the UB turn of eight of the cohorts used in this study. The extent of the particulate deposits (arrows) appeared to vary with both charge density and the technique used to achieve charge balance. (a) Implanted, unstimulated control (cohort 1): (b) 100 μC/cm2/phase with electrode shorting (cohort 2); (c) 228 μC/cm2/phase with electrode shorting (cohort 4); (d) 267 μC/cm2/phase with electrode shorting (cohort 5); (e) 267 μC/cm2/phase with electrode shorting and AP (cohort 6); (f) 267 μC/cm2/phase with electrode shorting and CC (cohort 7); (g) 400 μC/cm2/phase with electrode shorting (cohort 8); (h) 540 μC/cm2/phase with electrode shorting and CC (cohort 9). ET = electrode tract. Scale bar: 50 μm.