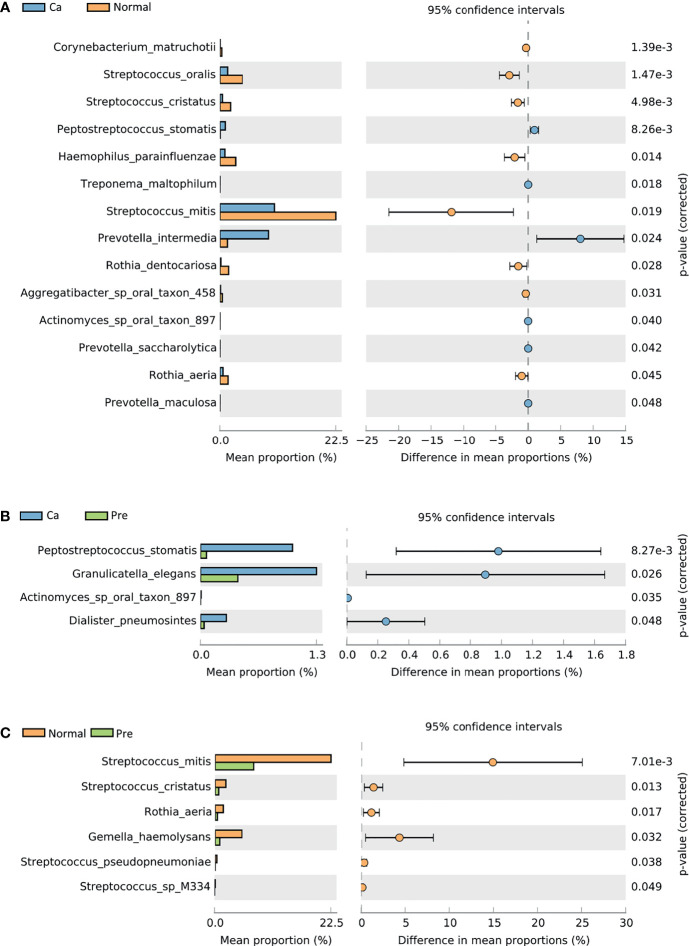
Figure 3.
Comparative taxonomic profiles at the species level showed significant differences in richness between two groups (P < 0.05, calculated using STAMP). (A) Difference between the oral cancer group and normal group. (B) Difference between the oral cancer group and precancerous lesion group. (C) Difference between the normal group and precancerous lesion group.

